Quantcast
Channel: Labour Market – The Progressive Economics Forum
Viewing all 76 articles
Browse latest View live

Dismal job numbers for June

$
0
0

Statistics Canada’s release of job numbers for June look truly dismal. The unemployment rate rose to 7.1%, and there was a loss of 9,400 jobs compared to May.  Year over year, employment rose by only 72,000. That’s a weak 0.4% and the lowest year-over-year increase since February 2010.

An even worse sign – all of that job growth was concentrated in workers over 65. One industry boasted over 80% of net new jobs year-over-year – health care and social assistance.

While there was an increase in full-time work and a a decline in part-time jobs, total hours worked actually fell (month over month AND year over year).  And, despite the fall in part-time jobs, underemployment remains elevated as over 1 million workers are working part-time jobs and need full-time work.

When you break the numbers down by province, well, I’m sure you can guess who is doing well and who isn’t. If we look at the change in both population and employment for 15-64 year olds by province, both Alberta and Ontario stand out.

working age pop

Year-over-year Alberta dominates both population growth and job growth. Ontario, on the other hand, comes in second for population growth, but is actually down nearly 30,000 jobs. Quebec is also notable, as it has had almost no working age population growth, but is down nearly 50,000 jobs compared to last June.

As for that long awaited pivot to business investment and exports, our own Andrew Jackson says that’s like waiting for Godot.

Edit: For those without Globe and Mail subscriptions, here’s Andrew’s analysis over at the Broadbent Institute.


More People Chase Fewer Jobs

$
0
0

Further to Angella’s excellent analysis:

Statistics Canada reported today that unemployment jumped by 25,700 in June because of shrinking employment and a growing labour force. Canada’s labour force expanded because of population growth, even though the participation rate did not increase. The combination of less employment and a larger working-age population depressed the employment rate to 61.4% – its lowest level since January 2010.

The Harper government has long trumpeted having a stronger job market than the US. In June, the unemployment rate rose in Canada but fell in the US. Statistics Canada reports that it is now the same on both sides of the border, even after adjusting for methodological differences between the two countries.

Continuing evidence of a weak Canadian labour market underscores the need for public investment in important services and infrastructure to help create jobs. Austerity is the wrong priority for federal and provincial governments.

UPDATE (July 12): Quoted by Canadian Press and today’s Toronto Star (page B1).

EI Falls as Unemployment Rises

$
0
0

Statistics Canada reported today that the number of people receiving Employment Insurance (EI) benefits fell by 12,070 in May – the largest drop in nearly two years. (The last time Statistics Canada records indicate a larger decrease was 12,670 in July 2012.)

This substantial decline in EI benefits comes as unemployment is rising. The Labour Force Survey indicates that unemployment increased by 15,200 in May and by a further 25,700 in June.

Overall, only 37.5% of unemployed Canadians received EI benefits in May (i.e. 504,080 out of 1,343,800).

The fact that fewer Canadians can access benefits even as more are unemployed likely reflects the Conservative government’s cuts to the EI system. The federal government should instead improve the accessibility and duration of benefits for workers who paid into the program and are unemployed through no fault of their own.

Revised LFS Numbers Don’t Change the Big Picture

$
0
0

What a rough week it’s been over at Statistics Canada.  It’s a world-renowned statistical agency — though its lustre has been tarnished in recent years by budget cuts, cancelled data programs and series, and the nonsense of the Harper government’s libertarian crusade against the long form census.  The problems this week around its Labour Force Survey report for July will certainly contribute to the sense of entropy surrounding this important and valuable institution.

The biggest change in the numbers is that full-time employment is now estimated to have declined by about 20,000, instead of the original 60,000.  Not exactly something to boast about.  60,000 part-time jobs were created (same as the original report).  The unemployment rate is the same as the original report — and exactly the same as 18 months ago.  The participation rate is unchanged from June: higher than in the original report, but still stuck at its lowest level since 2001.

I published a Globe and Mail commentary on Canada’s stagnant labour market based in part on the original LFS report.  Today’s revised numbers do not materially change the argument I made there, which is that Canada’s much-vaunted economic recovery was over-rated in the first place, and in fact ran out of steam a long time ago.  There has been no sustained labour market progress for over three years.  The employment rate is languishing just a hair above its level in June 2009 — the trough of the recession.  That means job-creation since the trough of the recession has only just kept up with growth in the working-age population (ageing demographics is part of that story, too, on top of poor job-creation).

And the revised LFS numbers still confirm a growing contrast between the accelerating U.S. recovery and the stagnation and “serial disappointment” (Stepehn Poloz’s catchy phrase) of Canada’s trajectory.  In the last year the U.S. economy created 2.3 million full-time jobs; Canada’s created barely any (with the smaller-than-originally-reported loss of full-time employment in July, the year-over-year change is now positive but miniscule).  The U.S. unemployment rate has dropped 1.7 points since January 2013.  Canada’s hasn’t budged.  The stark difference in macro policy stance between the two countries is clearly an important factor behind this take of two recoveries: American policy is emphasizing job-creation, and mobilizes conventional and unconventional levers to get there, while Canadian policy is dominated by orthodox concern with balancing the budget.

In short, I think Canada’s relative underperormance since 2011 will become increasingly damaging to the Harper government, given how much it has invested in its reputation (deserved or not) as the “best economic managers.”

Is Canada becoming a ‘part-time’ nation – the value of LMI

$
0
0

Most of the jobs added to the Canadian labour market in 2014 were part-time – prompting headlines such as “Experts fret Canada becoming a nation of part-time workers“.

Are we really a part-time nation? Well, 80% of workers in Canada are full-time, and a large majority of part-time workers choose to work part-time hours. So, no, we are not at the verge of some part-time workopolypse. But the labour market has been changing, driven partly by demographics (aging) and women entering the labour force.

Between 1976 and 2013, the number of core-age women working part-time jobs more than doubled – but the proportion of those women working part-time actually fell.

wwpt

Source: CANSIM 282-0002

In the early 1980’s about one in four (25%) working women between 25 and 54 held a part-time job. By the mid-2000’s that number had dropped to one in five (20%). This means that as women entered the workforce in huge numbers, it became more common for them to hold full-time jobs as well.

A breakdown of part-time workers by age yields some interesting findings as well. When people think of part-time workers, they overwhelmingly picture pimply teenagers. But over time that has been less and less true.

Source: CANSIM 282-0002

Source: CANSIM 282-0002

In 1976, more than 30% of part-time workers were between 15 and 19 years of age. Now they make up less than 20% of the part time work force.

At the other end of the age spectrum, workers between 50 and 65 used to comprise only 10% of all part-time workers, and now make up more than 20%. As older workers need to stay in the labour force longer in order to supplement failing (or absent) pensions, this trend will likely increase.

All of this sparks a larger question: Why should we care about the number or proportion of part-time workers anyway?

Labour economists dissect the details of the monthly Labour Force Survey with the intensity of wild animals who have landed a fresh kill. We’re hungry for data and answers, and search endlessly for the crosstab that will give us a fresh perspective on what’s happening in people’s lives across the country.

We care about the number of jobs, the quality of jobs, and the wages of jobs, because we care about the well-being of workers and their families. Under our current economic system, jobs are the main way that we distribute wealth – so it matters, a lot.

Very often the Labour Force Survey doesn’t have the answers. But it gives us a place to start asking questions.

Indigenous Workers in Canada

$
0
0

Labour market data in Canada is easily available by sex, age, and region. We spend a great deal of time talking about these factors. More recently Statistics Canada made labour market data available on CANSIM by landed immigrant status, going back to 2006. This factor is less often included in most labour market analysis, and too few know that it is even available.

But if you want to know how racialized workers or Indigenous workers (First Nations, Métis, and Inuit peoples) are doing in the labour force you basically have to rely on the census … oh, wait. And on top of eliminating the census, the Harper government shut down the First Nations Statistical Institute.

So imagine my delight when a recent search on the issue turned up an article from the Centre for the Study of Living Standards about Indigenous employment that cited the Labour Force Survey as a source.

I should have already known that the Labour Force Survey asked an Aboriginal identity question, but I didn’t. A quick call to Statistics Canada revealed that this data is freely available on request, but is limited to First Nations, Métis, and Inuit peoples living off reserve (since the LFS doesn’t survey persons living on reserves).

I plan on doing a more thorough analysis, but I thought that I would post a few quick insights, and get the word out so that anyone who is interested can call and get the data for themselves.

Some of this data confirms things that we ‘know’, but having the hard numbers helps when we’re calling for action. For example, unemployment is a HUGE issue for Indigenous young workers living off reserve, before, during, and after the recession. The unemployment rate reached a high of 22.5% in 2009, and was still 18% in 2013.

IndigenousUe

While I don’t have the data to calculate underemployment, consider that underemployment rates seem to be about double unemployment rates for the general population. That suggests an underemployment rate of at least 36% for Indigenous young workers in 2013.

Unemployment rates for Indigenous workers are much higher than for non-Indigenous Canadian born workers, and are comparable to that of new Canadians.

IndigenousLICBUe


As you can tell by the graph, the recession was more severe and lasted longer for Indigenous workers and new Canadians.

So whenever we’re talking about labour market strategies and good jobs, it’s important to keep in mind that for some workers there are systemic barriers that need to be addressed. Hopefully access to labour market data for Indigenous workers and new Canadians can be one way that we convey the need for action.

If you want to read more about Indigenous workers and the labour market in Canada the CSLS has a study using LFS data from 2007 – 2011, the Conference Board of Canada has a more employer driven study from 2012, and a 2011 paper in aboriginal policy studies by Friedel and Taylor analyses the colonial discourse in Indigenous labour market development policy in Northern Alberta.


Self-Employment Masks Job Loss

$
0
0

Statistics Canada reported today that employers cut the number of employees by 98,000 in August, which was largely masked by 87,000 more Canadians identifying themselves as self-employed. As a result, the headline level of “employment” – which includes self-employment – was little changed.

Self-employment ranges from high-income professionals to people eking out a living doing odd jobs. However, when a large increase in self-employment coincides with a large drop in positions paid by an employer, it begs the question of whether Canadians are becoming self-employed by choice or because jobs are not available. One also wonders how many survey respondents are simply more comfortable reporting themselves as self-employed rather than unemployed.

The headline numbers are weak and they would be disastrous but for the surge in self-reported self-employment. Policymakers must focus on creating jobs and ensuring adequate benefits for jobless workers.

Terrible, Horrible, No Good, Very Bad Job Numbers

$
0
0

Today Statistics Canada released their first set of job numbers since the ‘oops’ of July 2014. And the news was dismal. The labour market shed 112,000 private sector positions, the largest single month drop in the private sector since, well, forever. Coming on the heels of a mistake is unfortunate, but you have to think that Statistics Canada was extra vigilant this month and checked everything up, down, backwards, and sideways.

Either way, month to month variations are far less meaningful than overall trends, so let’s have a look at those, shall we?

Part-time work

Only workers over 55 have seen an increase in full time work compared to last August, and most of this is likely due to demographic change. Among core age workers there were fewer full-time jobs and more part-time jobs. Young workers traded 3,000 full-time jobs for less than a thousand part-time ones.

Part-time

Source: CANSIM 282-0087

Temporary work

The picture is quite similar for temporary employment. Year over year, core age workers saw a drop in the number of permanent jobs, and an increase in temporary employment. Temporary


Young Workers

Young workers in particular have difficulty finding work when the labour market is slack. As do new Canadians. So it would follow that young workers who are also new Canadians have an even harder time. The graph below shows the unemployment rate for young workers as a 12 month moving average from January 2007.

At it’s peak, the unemployment rate for young workers who had been landed immigrants for 5 -10 years almost hit 25%. While the unemployment rate for Canadian born young workers remains elevated over its pre-recession level, the trend seems to be gradually falling. On the other hand, the unemployment rate is rising for all three categories of new Canadian young workers.

Source: CANSIM 282-0103

Source: CANSIM 282-0103


Public / Private mix

Such a huge drop in private sector employment is a concern, since the labour market has been very heavily relying on private sector gains for the minimal job growth we have seen this year. And the huge spike in self-employment is also worrisome, as these jobs are more often precarious ones.

The good news is that this months drop in private sector employment and spike in self-employment didn’t really change the overall mix when you look at the average over the past twelve months and compare this to the year before.

Source: CANSIM 282-0011

Source: CANSIM 282-0011


With far too few job vacancies, and record low proportions of unemployed workers receiving EI (especially in urban areas), the Canadian labour market is looking pretty depressing. I think there’s going to be a lot to discuss at Unifor’s upcoming Good Jobs Summit in Toronto.


Should Welfare Recipients Try Harder to Find Work?

$
0
0

This morning the Social Research and Demonstration Corporation released a new report about “motivational interviewing” for welfare recipients.  The link to the full report is here, and the link to the executive summary is here.

Authored by Reuben Ford, Jenn Dixon, Shek-wai Hui, Isaac Kwakye and Danielle Patry, the study reports on a recent randomized controlled trial done on long-term recipients of social assistance in British Columbia.  The research took place between September 2012 and March 2013.  There were a total of 154 research participants; 76 of the individuals were in the “treatment group,” while 78 were in the “control group.”

Earlier this year, I was invited to be a discussant on the study at the Annual Conference of the Canadian Economics Association.  Here are 10 things I think you should know about this report:

1. The “intervention” being studied was the Motivational Interviewing (MI) technique.  MI is “a method of interacting with clients who are ambivalent about making change in their lives.” It has “wide application in behavioural change: addictions, health, behaviour wellness, chronic disease management, and most recently in the employment field.”  For more on MI, see this web link.

2. Research participants were on welfare upon enrollment in the study.  By “welfare,” I mean last-resort social assistance.  For most eligible residents in British Columbia, this is known as “income assistance (IA).”  Upon being recruited for the study, most research participants were receiving approximately $1,000 per month to live on; this amount included “health supplements,” as well as “general supplements” for such things as transportation.  Research participants had also been identified by British Colombia’s Ministry of Social Development as being “employment obligated,” which means they were expected to be actively searching for paid employment.  (For more on benefit levels available under social assistance programs administered by provincial and territorial governments, see this 2013 report.  Readers should be mindful that, across Canada, there are separate social assistance systems for First Nations; a 2007 evaluation of the federally-administered “income assistance” program for First Nations can be found here.)

3. Research participants had been on welfare for at least one year at the study’s outset.  The rationale behind this recruitment strategy was to identify social assistance recipients who were most likely to be facing motivational challenges.

4. Most of the research participants reported health problems.  According to the report, more than 70% of study participants “reported activity limitations that affected their ability to work.” For example, just one-quarter of members of the treatment group reported that “their health was ‘good’ or ‘very good…'”  With this in mind, it’s not entirely clear to me why British Columbia’s Ministry of Social Development considers these individuals to be “employment obligated.”

5. The “intervention” was provided by welfare officials (specifically, by Employment and Assistance Workers and case managers).  Remarkably, each staff person received fewer than 70 hours of training before delivering the intervention (specifically, 60 hours of training in how to deliver MI and then nine hours of coaching as the intervention was being delivered).  The training of staff was provided by Empowering Change Inc., a Canadian-based organization that (perhaps not surprisingly) specializes in training people on how to deliver MI.  Members of the study’s control group “received the range of services and treatment which they would typically receive” as long-term recipients of social assistance.

6. The results of this study suggest that Motivational Interviewing can be effective.  By the end of the three-month study period, the difference in the respective employment rates of the treatment group and the control group was statistically significant.  The precise size of the difference in the employment rate between the two groups was 7.8%. (For the research wonks:  the level of statistical significance attained on this was 5%.  Put differently, the likelihood that this finding occurred by chance is less than 5%.)  This finding raises a question for me though:  what would outcomes have been for members of the treatment group after 12 and 24 months respectively?  Three months is not a long time.

7. Fewer than half of the members of the study’s treatment group actually took in even one (hour-long) Motivational Interviewing session.  Just 36 of the members of the study’s 76 treatment group members chose to go through with a Motivational Interview.  And only about one in five members of the treatment group took in more than one such session.  Ergo: the success of the treatment group as a whole appears to have been carried by a minority of its membership.  This suggests to me that the success of the treatment group is actually being understated; had every single member of the treatment group actually received the intervention (and not merely been offered it) I suspect the treatment group as a whole would have performed even more favourably compared with the control group.

8. The research was funded by Employment and Social Development Canada (ESDC).  On the one hand, I suspect that most readers will not be surprised to learn that the federal government wants most people on welfare to ‘look harder’ for work.  On the other hand, it may come as a surprise to some readers (especially those who remember the Harper government’s decision to end the mandatory long-form census) that the federal government has funded research looking at what is effective in this regard.

9. The study took place at a time when, throughout Canada, there were considerably more unemployed persons than job vacancies.  Across Canada there are roughly six unemployed persons for every job vacancy (a ratio that varies considerably across provinces).  This raises an important question:  in a country where the number of unemployed persons vastly outnumbers job vacancies, why does the federal government want to study the feasibility of long-term recipients of social assistance (many of whom have serious health problems) trying harder to find low-wage work?  Some readers will remember a Toronto study conducted in 2001 that followed more than 800 individuals who had left welfare within the previous year.  Fewer than half of those individuals “felt things had improved financially” for them since leaving social assistance; on the whole, after leaving social assistance, individuals “reported incomes at approximately 92% of Statistics Canada’s 2001 Low Income Cut-Offs.” (Further analysis of this Toronto study can be found here.)

10. This study took place at the same time that the federal government is aggressively bringing in more temporary migrant workers.  As Jim Stanford has recently noted: “Migrant employment [in Canada] rose 140 per cent between 2005 and 2012.” Further, “[o]ne in every five net new paid jobs created in Canada between 2007 and 2012 was filled by a migrant worker.” This raises yet another question for me:  why is the federal government interested in exploring how to encourage more welfare recipients to look harder for low-wage jobs while (simultaneously) ‘importing’ competition for many of those same jobs at an aggressive pace?  Don’t the two objectives work at cross purposes?

Of Rising Tides and Sinking Boats

$
0
0

Recently, Minister Kenney took to twitter to defend his decision to limit the number of precarious workers entering Alberta through the Temporary Foreign Worker Program. Again, the minister is to be applauded for his grasp of the situation. His changes do little to fix the actual problem though.

The evidence that he cited was the lack of wage growth among restaurant workers in Alberta. The graph below shows that, adjusted for inflation, restaurant worker wages in Alberta peaked in 2010, and have fallen since then by over $35 / week. At the same time, the overall average weekly wage has risen by $67 / week. Wages for retail workers haven’t budged, and manufacturing wages have risen only slightly.

Source: CANSIM 281-0027

Source: CANSIM 281-0027

What is driving this? Workers bargaining power has been restricted in two ways. First, workers employed through the Temporary Foreign Worker program are tied to a single employer. Second, many are not allowed to unionize. If a worker is unhappy with the wages or working conditions of their job, they can neither band together to demand better, nor walk across the street to a better employer.

The result is that employers do not have to raise wages to attract and keep workers. If there is a sufficient supply of vulnerable labourers, then current non-TFWP workers may be easily disciplined with the treat of being replaced by a willing temporary worker.

Limiting the pool of workers whose bargaining power is restricted may improve the situation of non-TFWP workers somewhat, if it means that they are less likely to believe the treat of being replaced. But it does nothing to improve the situation for temporary workers.

If there is a need for more low-skilled workers in Alberta, then Alberta should open up temporary and permanent immigration for low-skilled workers. But all workers should be allowed to move between employers, and to bargain wages and working conditions through the union of their choice. The best way to enforce employment standards is by giving workers the power to stand up for themselves.

Liberal’s EI Plan Rests on Bad Math

$
0
0

Joe Oliver recently announced a Small Business Tax Cut, sorry, Job Credit. Economists across the ideological spectrum denounced it as poorly designed.

This opened up an interesting opportunity for a national debate about what we want E.I. to be – coverage right now is at all time lows, and the accumulated deficit from the last recession will soon be repaid in full.

The Liberal Party entered the EI debate by suggesting a one-year EI premium holiday for employers who hire new workers. It’s disappointing that they completely ignored the possibility of expanding access. What’s even worse is that their plan rests on some pretty terrible math.

How much do they think a one year EI premium holiday for new hires will cost? Why, they can create 176,000 jobs for the low price of $225 million / year.

Sure, you say, the maximum EI contribution for employers is around $1250 / year, and 176,000 * $1250 = $225 million. No problem.

But, wait! How do you define new job? And how many ‘new jobs’ are created in the Canadian economy in any given year? You might think that it’s in the 176,000 range if you listen to any of the coverage of the Labour Force Survey release at the beginning of every month. But you’d be wrong.

The Labour Force Survey counts ‘net new jobs’, which is the the number of new hires minus the number of job leavers in a given month. Between August 2013 and August 2014, there was an average of 6,000 net new jobs every month.

But the total number of new hires is much larger than the number of net new jobs. People leave one job for another, and move into and out of the labour force regularly.

Although Statistics Canada doesn’t measure new hires directly, it does ask “how long have you been in your current job?”. We can say that people who answer “1 month or less” is a pretty good proxy for new hires. By this metric, there were approximately 3.7 million new hires in 2013. That’s 310,000 per month.

The Liberals will have blown through their annual budget for the EI premium rebate about two weeks after it has been introduced.

This plan confirms two things. The Liberal Party of Canada is totally OK with an EI coverage rate of 36%, and they aren’t really sure how the labour market works in Canada.

Labour market musings

$
0
0

Just a short post ahead of the job numbers that come out from Statistics Canada tomorrow. Five years after the end of the last recession, and Canada’s labour market is still limping along. And it seems to have taken a turn for the worse recently.

While the Conservative government crows about one million net new jobs, they conveniently forget to mention that we would need to add another 880,000 new jobs to the Canadian economy to catch up to our pre-recession employment rate.

On average, that’s about 73,000 jobs per month, every month, for a whole year. This is unlikely to happen given our current job creation trends. Over the past year, we’ve added fewer than 7,000 jobs per month, which is only about one-tenth of what we need to put unemployed Canadians back to work.

Growth

And as we always hear, demographics matter. Here’s what that chart looks like for men and women between the ages of 15 and 64.

demographics

We’re short 300,000 full-time jobs for workers 15-64. In other words, in order for the employment rate of working age Canadians to return to its pre-recession level, we need to add 300,000 full-time jobs in that age category.

That’s half the number of jobs that went missing in the depth of the recession, but double where we were a year and half ago. The situation is getting worse, not better.

Gap


Another issue of growing concern is the continued high rate of long term unemployed workers (highlighted by today’s PBO report on EI).

CANSIM Table: 282-0047

CANSIM Table: 282-0047

Just a few things to keep in mind when you’re reading the labour market analysis tomorrow, whatever the monthly numbers say.

Job Numbers Surprise

$
0
0

For the first time in a while, Statistics Canada gives us some good news on the job front. 74,000 net new jobs added in September, certainly nothing to sneeze at. Still, we would need to keep this pace up every month for the next year to close the employment gap left by the last recession.

On the graph below, this month’s huge uptick barely makes a dent. The blue line is how many jobs we have, and the dotted pink line is how many we would have if the employment rate were 63.6%.

webpotential


This holds true for workers age 15-64 as well, but in terms of total employment is a bigger issue for men (it is still a he-cession). The potential job growth lines (shown as dotted lines on the graph), are based on pre-recession employment rates. A year and a half ago, women were very close to their potential employment rate, but the trend has fallen off a bit since then.actualvspotential

More women work part-time than men, for various reasons, but it’s often to accommodate unpaid care work or because they can’t find full-time work. The number of men and women working part-time involuntarily is higher this September than it’s been in a month of September since 1997.

invPT

And for young workers who are new to Canada, there has been no recovery.  In the chart below I compare actual and potential employment for the months of September since 2006. To graph potential I use both the Canadian born young worker employment rate, and the new Canadian young worker employment rate.

actualvspotentialnewyw

Overall, recent immigrants have seen fewer jobs return. The unemployment rate for recent immigrants (less than 5 years) stood at 13.7%, compared to 6.5% for Canadian born workers. We don’t just need to create jobs, we need to create good jobs, and they need to be available to everyone.

Bank of Canada, Exports, and LMI

$
0
0

Much has been made about Stephen Poloz’s decision to abandon ‘forward guidance’ in Bank of Canada rate setting announcements for the time being. Critics bemoan the loss of direction from the Bank. But Poloz’s comments yesterday were chock full of guidance on how the Bank sees Canada’s economic situation.

Having been disappointed by the failure of Canada’s export sector to resume investment or show any signs of life, researchers at the Bank investigated the performance of 2,000 product categories, and found that about 500 of those had very nearly been wiped out following the 2008 – 2009 recession. Further investigation found a permanent loss of capacity in some manufacturing export sub-sectors. Most surviving manufacturing exporters are still operating at or below capacity. This means we shouldn’t expect a whole lot of business investment in these sectors any time soon.

This permanent loss of capacity isn’t truly permanent, we can rebuild, but doing so will take more time, and will wait until conditions are much more certain. This has disastrous consequences for workers, particularly in southern Ontario where much of the loss has been located.

Stephen Poloz’s statement is clear on this. The size of the output gap is somewhat deceptive because of this loss of capacity. A clearer picture of the weakness Canada is experiencing shows up in the labour market gap. Which the Bank very carefully measures, by the way. The Bank’s aggregate LMI diverged from the unemployment rate in late 2012. TD Economics put together their own aggregate labour market indicator, that also shows the labour market is weaker than the unemployment rate shows.

This might be the perfect time for some public infrastructure investment (as recommended by the IMF), say, in affordable childcare spaces.

Low Oil Prices, Good or Bad for Canada?

$
0
0

Unless you’ve been hiding under a rock somewhere, you’re probably well aware that the price of oil has fallen dramatically, to less than $50 / barrel. What this means for Canada’s economic output & labour markets is not yet clear. But Stephen Poloz at the Bank of Canada has said that he expects the effect to be “not trivial”, and suggested that it might lower the Bank’s GDP expectations by around 0.3 percentage points. Deputy Governor Timothy Lane’s talk on January 13th is good background reading on this topic, and overall he suggested that the effect will be at least somewhat negative for the Canadian economy. Other commentators have suggested that the lower dollar and the US economy’s pick-up will swamp any negative effects, leading to an overall positive effect nationally.

There are several reasons why I would side with the more pessimistic predictions. I also think that the policy response to a more pessimistic outlook is consistent with the policy response to medium and long term global constraints, such as climate change. Let me tell you why.

I’ve commented earlier on the Bank of Canada’s review of manufacturing capacity lost during the past recession, and the CIBC has put out a note on this as well. Avery Shenfeld and Andrew Grantham point out that significant capacity loss has been centred in manufacturing sectors that are sensitive to changes in the Canadian dollar (and therefore might be poised for a period of expansion). It takes much longer for business to respond to exchange rate signals when they don’t have existing excess capacity. Shenfeld and Grantham suggest that it could take several years of an 80 – 85 cent dollar before we saw a return to a vibrant manufacturing sector in southern Ontario. This is different than previous recessions, where Ontario had excess manufacturing capacity that could quickly respond to price signals.

Also, communities in Ontario and Atlantic Canada have depended on remittances from workers who either commute or move to Alberta for high -wage jobs in the tar sands or construction. These workers are likely to be laid off first, creating a drag on the economy that will be felt far outside Fort McMurray.

The other fear is that Alberta and the federal government will respond to lower revenues with more cuts, that will act as a further drag on economic growth. This would be the least effective response, but given current provincial and federal leadership, is also the most likely.

Rather than cross our fingers and hope for a manufacturing led recovery, I think that all levels of government, unions, and business need to think about what kinds of infrastructure we need to put in place to be ready for long term challenges. Governments especially should think about what kind of infrastructure would encourage new economic growth, rather than simply handing out funds to existing business.

A recent Nature paper suggests that negative economic impacts can be mitigated by taking early action on climate change. I think we’ve missed the boat on ‘early’, but sooner is always better than later. The earlier a jurisdiction can introduce a carbon pricing scheme (such as the one Ontario is expected to announce this year), the sooner businesses and individuals can adjust. This would give them a competitive advantage against firms in jurisdictions that are slower to respond to what is arguably an inevitable reality.

Let’s look forward to new challenges with new thinking. We’ll never dig ourselves out of the hole we’re in by using the tools that got us here in the first place.


Banks and Balanced Budgets

$
0
0

The Bank of Canada surprised most analysts this week when it decided to cut rates by 25 basis points. The move comes after the price of oil has tumbled below $50 / barrel, oil producers announced huge cuts to business investment for 2015, Target announced a mass layoff of 17,600 workers in Canada, and the International Monetary Fund warned of a global economic slowdown.

The key message of the January Monetary Policy is that the Canadian economy needs stimulus. The Bank’s view of the Canadian economy stands in sharp contrast to that of the federal government, which is intent on delivering a balanced budget with a basket full of family tax cut goodies. By spending their surplus before they had even secured it, and then also sticking to an unrealistic balanced budget timeline, this government painted themselves into a corner, and made themselves look very foolish.

Thank goodness that the Bank was willing to act, and put the wellbeing of Canadians over concerns of a housing bubble and excess household debt.

So, what was the biggest outcome of the announcement? The loonie fell to 81 cents USD, down nearly two cents on the day. It is now five cents lower than it was on January 1st. Since oil and other commodities are priced in US dollars, the lower loonie effectively boosts prices for Canadian commodities producers. For those that were operating at or just below their short-run cost margins, this is great news. According to the following chart taken from Timothy Lane’s remarks on January 13th, that includes several sites in Canada.

SRMarginalcostOil

While many analysts pointed to how this move was good for manufacturing, the most immediate impact of the Bank’s rate cut is to save thousands of jobs in the oil, gas, and mining sector.

As I’ve pointed out before, the benefit to manufacturing depends partly on the ability of existing manufacturing firms to grow. New entrants will be unlikely to rely on the lower dollar to stick around forever, but may be able to use the current cushion to get their projects off the ground. This will take some time. The lower dollar increases most machine and equipment input costs, so labour intensive firms actually have the advantage in the current environment.

The Bank issues its next rate announcement in March, and many observers are considering the possibility of another rate cut at that time. What is that likely to depend on? Well, the Bank based their estimate on $60 oil, and it’s currently below $50. The price is unlikely to rise until something gives on the supply side. Canadian and American producers are currently saying that their production will increase this year, just at a slower rate than last year. Saudi Arabia seems intent on keeping supply high until it forces some of those North American producers out of the market. If the price of oil stays low for the next couple of months, we could easily be looking at yet another cut from the Bank. Would it be enough for Stephen Harper to give up on a balanced budget? That’s a tougher question.

Rochon Asks: “Is the Canadian economy unraveling?”

ROCHON: Harper in closet over the economy as Canada heads toward another recession

$
0
0

This guest blog post has been written by Louis-Philippe Rochon.

You can follow him on Twitter @Lprochon

Harper’s recent incarnation as an anti-terrorist crusader has caught many Canadians by surprise. Harper is spending considerable political energy beating the drums of war against terrorists, and introducing a far-reaching, and much condemned, bill aimed at restricting free speech, and increasing police powers. But could this move hide a more cynical purpose? Can there be an ulterior motive?

I think there is, and the reason is quite simple. It’s the economy. Seven years after the beginning of the crisis, and 4 years after the official end of the crisis, the economy is slowly (or not so slowly) heading in the wrong direction. In fact, I don’t think we can exclude the possibility of a recession late in 2015 or early 2016.

Consider the economic facts. In 2014, the Canadian economy had a rather weak year. In November, the economy actually contracted by 0.2% mainly as a result of a weak manufacturing sector. It is the economy’s worst performance in almost a year: on a year-over-year basis, growth in Canada slowed to 1.9% from 2.3% in November.

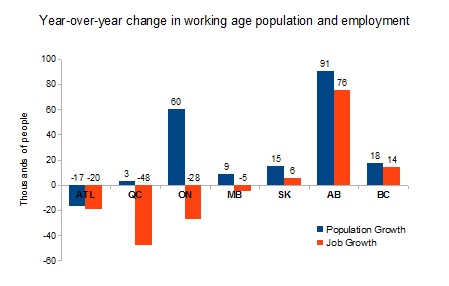
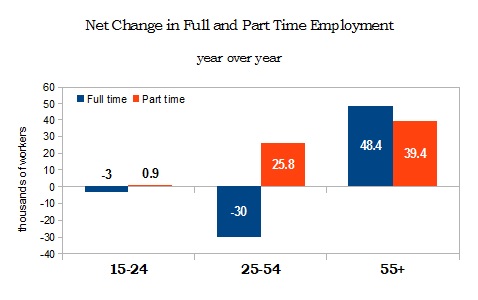
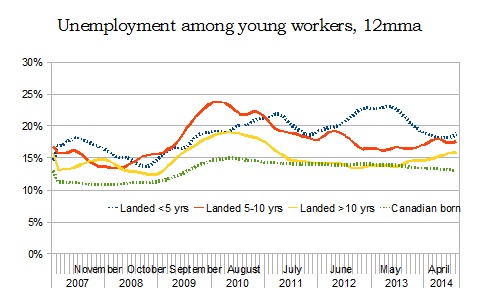
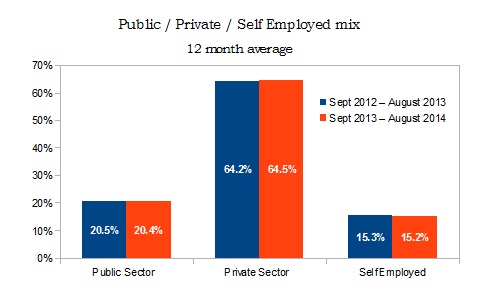
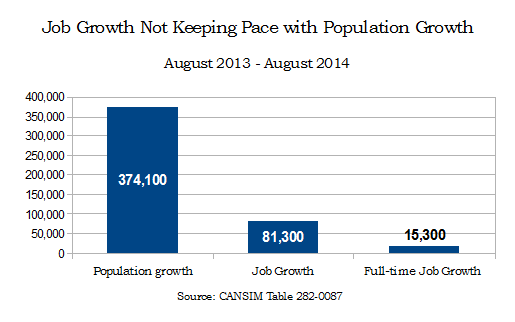
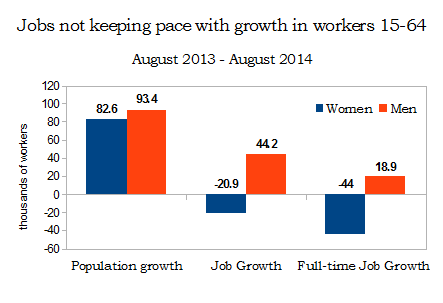
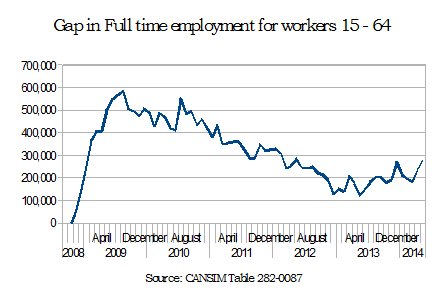
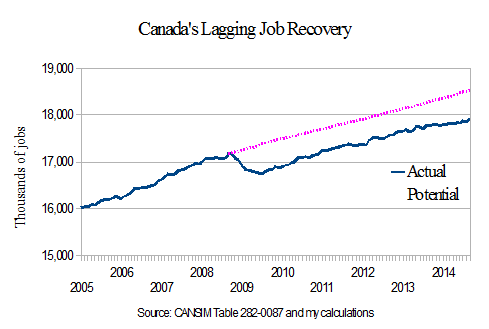
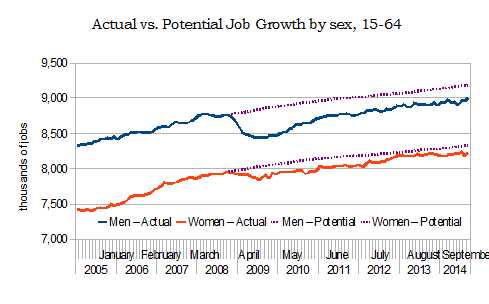
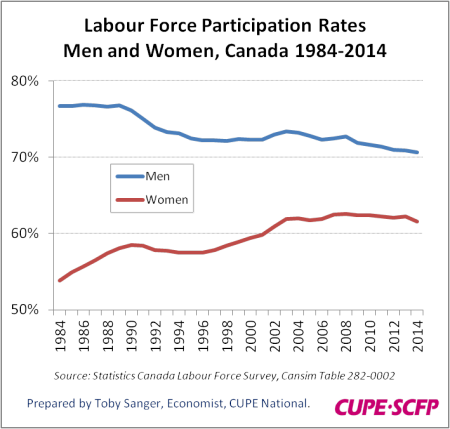
As for the labour market, unemployment is up, and job creation is down, and we are still nowhere near pre-crisis levels. In Statistics Canada’s labour market revisions last week, unemployment rate inched upward to 6.7%. Moreover, the Canadian economy in 2014 only created 121,300 jobs and not the 185,700 jobs initially reported. That’s an enormous discrepancy, a 35% discrepancy to be exact. On top of that, the economy actually shed jobs in the last 2 months. As for the labour force participation rate, it now stands 65.7% (revised down from 65.9%). Right before the crisis, it stood at roughly 67.7%. At this point in the recovery, we should be doing much better.

The recent decline of the loonie could be seen in some positive light, because it may lead to an increase in exports especially in vote rich Ontario and Quebec, but for this to occur, our trading partners’ economies must be growing at some respectful rates. And I am thinking here more of the US and China.

Everyone is predicting strong growth in the US economy in 2015, yet after growing at close to 5% in the 2nd and 3rd quarters of 2014, the US economy has slowed down to 2,6% in the 4th quarter (lower than expected); in fact the 2013 Q4 to 2014 Q4 growth rate was only 2.5%, which is less than the 3.1% recorded in 2013.   Now, just released, November’s US trade deficit is up, and there are expectations that December’s growth rate will come in below 2%.

In November, Canada’s manufacturing sector shrank by 1.9% even though our dollar was falling. This was a surprise to market observers who were expecting a slight upward bump.

And then, there is the question of our monetary policy. The Bank of Canada’s Hail Mary reduction in interest rates a few weeks ago (in an international beggar-thy-neighbour poliy, it seems) was a clear admission of the malaise creeping into the economy.

And now, the yield curve, a spectrum of yields on bonds of various maturities, has inverted. As of last week, the return on 5-year bonds fell below the overnight rate of 0.75. Now this is a big deal and it does not happen often. This is a sign that markets are factoring in another decrease in overnight rates, and reflects a general uneasiness about the direction in which the Canadian economy is going.

In fact, in some research of the US economy, it has been shown that a yield curve inversion more often than not announces a recession possibly as early as 6 to 9 months later. Yield curve inversions are usually followed by a credit crunch, where banks are more reluctant to lend, and the economy slows down. If this view holds, then we could possibly be looking at a recession in Canada anytime in between July and October – smack in the middle of a federal election campaign!

With his economic cards on the table, Harper’s hand is proving to be very weak. In order to win an election, he must create momentum, but the state of the economy won’t give him this opportunity. Note how silent the PM has been lately on the economy.

Armed with the same data, his advisers are surely telling him to avoid talking about the economy. So if you are the Prime Minister who has prided himself on strong economic policies, who has boasted his government’s record on prosperity, what can you do?

Well, the answer is simple: change the channel. In other words, redirect the debate toward something else, something that will hopefully distract the voters. But this issue must be big, something so terrible in fact that no one will even remember that the economy is heading in the wrong direction.

Enter the war on terrorism. Perfect topic. After all, who is not in favour of fighting terrorism? Harper will surely paint all those against him as terrorist sympathizers, and the opposition has fallen into the trap. And the timing could not be better: Parliament Hill in Ottawa just got attacked, and so were the offices of Charlie Hebdo in Paris. So let’s strike when the iron is hot.

Unfortunately, voters’ attention span is limited, and even the war on terrorism cannot be sustained for a whole 8 months. So expect Harper to do the next best thing: call an early election. This will serve two purposes: keep the terrorism debate alive for a much shorter time, but also avoid the unpleasant and inconvenient discussion of what is happening to the economy, and face the electorate when the economy gets too obvious that it can no longer be ignored.

It will be up to the Opposition parties to keep the economic topic alive, and Harper will try everything to avoid talking about it.

January Job Gain Part-time, Self-employment

$
0
0

As usual, the monthly Labour Force Survey numbers headline seems to tell a different story than the underlying numbers. According to the LFS, Canada added 35,000 jobs in January. A statistically significant number of jobs, hurray!

But wait. Those were all part time jobs. We lost 10,000 full time jobs, and added 47,000 part-time jobs.

Oh, and they were all through self-employment. We lost nearly 6,000 jobs, but 41,000 Canadians entered the labour market through self-employment.

In fact, compared to last January, half of all employment growth was through self-employment, with an increase of over 68,000 self-employed workers. The overwhelming majority of those workers  were in the most precarious self-employment category – unincorporated with no paid help. Between January 2014 and January 2015, there was an increase of 53,500 self-employed workers who were unincorporated with no paid help. (All of this data is not seasonally adjusted).

Another sign of concern is the number of involuntary part-time workers, discouraged workers, and those waiting for jobs that start in a couple of months.

The underemployment rate has fallen by less than the unemployment rate has. This is most clearly shown by calculating the ratio of the two. Using seasonally unadjusted data, and comparing the last ten Januaries, the ratio of underemployment to unemployment is markedly higher in January 2015.

Underoverun


All of this points to underlying weakness in the Canadian labour market, on top of bleak prospects for the near term. The mayors are meeting in Toronto this week, and asking for stable funding to build much needed infrastructure. The weakness in the labour market is just one more reason that the federal government should listen very closely to what the mayors are asking for.

Why are women leaving Canada’s workforce?

$
0
0

I started producing an e-weekly earlier this year, Eye on the Economy: making sense of recent economic events, as a more regularly complement to the quarterly Economy at Work I also produce.

Each issue contains a main commentary/analysis piece on a topical issue and also a curated round up with about five shorter briefs.  In an age of info overload and never ending tweets, it’s meant to provide a decent summary of relevant economic events.

The main piece from a few weeks ago, on “Why are women leaving Canada’s workforce?” is relevant with international women’s day this weekend.  For me, it’s also a bit of a puzzle — and I’d appreciate comments on this from readers of this blog.

If you’re interested, please sign up here to receive it.  I’ll try and repost relevant here, but I’ve been lousy at doing it so far and can’t guarantee I’ll have the time!

———————————————–

Why are women leaving Canada’s workforce?

Women left Canada’s labour force in record numbers last year. Who are they and why did they leave?

Over 80,000 women left Canada’s labour force in 2014, bringing their labour force participation rate down to 61.6 per cent from 62.2 per cent in 2013 (all figures annual averages). This is the lowest rate since 2002, and a reversal of decades of gradually growing gender equality through women’s participation in the workforce.

Historical LF partipication rates

If women’s participation rates hadn’t declined in 2014, the unemployment rate for women unemployment rate would have risen from 6.4 to 7.3 per cent. This would have been the highest annual rate in 15 years and even higher than it was during the 2009-10 recession years.  While there was a decline in women’s labour force participation immediately following the recession of the early 1990s, the decline last year comes five years after the recession was supposedly over.

The exodus is concerning for a number of reasons. Women, their household incomes and public revenues will all lose out from lower incomes. If women are leaving the labour force because of a lack of opportunities, inadequate pay or because they are overloaded with work and family responsibilities, it should also be a major concern.

Lower labour force participation will also put a damper on long-term growth of the economy, which is a reason Canada together with other G20 nations agreed last November to set a goal of narrowing the gender participation gap by 25 percent by the year 2025. Just a few months into this commitment and Canada’s gap in women’s participation rates has widened rather than narrowed.

Part of the overall decline in participation rates is due to population aging: as a greater share of the population enters retirement age, participation rates naturally decline. But while this explains the drop in men’s participation, it doesn’t explain the greater drop for women. The biggest declines in workforce participation have been for middle-aged women aged 40-54.  It’s also not a regional story. For the first year since at least 1977 participation rates for women dropped in every single province in Canada last year.

So what explains this exodus of women from the labour force?

It isn’t because women are retiring early because they can afford to on their own. Occupations with the greatest decline in female employment were clerical (-36,000); trades, transport, equipment operators and construction (-14,000); professional occupations in health such as nurses (-16,000); and middle management (13,000). Most of these aren’t higher paid occupations with early retirement benefits.

The industries with the biggest declines of women in their workforce in 2014 were manufacturing, trade, transport, finance and insurance, business and support services, and other and unclassified services. In total the female labour force declined by more than 80,000 in these industries, while the male labour force increased by an almost identical amount in these same industries. Employment trends in these industries follow a similar pattern.

LF gains n loss by industry

The decline in women’s labour force participation wasn’t the result of an overall decline of employment in more female dominated industries, as some have suggested. On the contrary, labour force and employment levels of women in the most female dominated industries—education, health and social services and accommodation—all increased, while declining in the more heavily male-dominated industries. This means despite all the promotion of women in non-traditional occupations, Canada’s workforce became even more divided by sex last year.

Other explanations recently offered also come up short. While fertility rates have risen for older women, they’ve been more than offset by declining fertility rates for younger women, so this factor shouldn’t explain an overall decline in participation rates for all women. The rising share of landed immigrants with lower rates of labour force participation only explains about a tenth of the total decline in women’s labour force participation last year: participation rates declined at an equal rate for women born in Canada as for immigrant women.

Clearly we need to look elsewhere for explanations.

Countries with higher pay gaps for women also tend to have lower female participation rates. Higher child care costs and family caregiving demands for elders and other dependents also significantly reduce women’s labour force participation. More and more workers are also feeling overloaded: 60 per cent of respondents to a Globe and Mail survey reported feeling stressed and on edge at work.

There’s been very little progress in reducing pay gaps for women. In fact the gap has increased in recent years. The Harper government’s economic policies have focused heavily on male-dominated construction, resource-extraction and military-security industries and tended to emphasize more traditional family values. The lack of support for affordable childcare and introduction of tax measures that increase incentives for women to stay home may also have an impact.

Together, these economic and social factors could be the reason why more women are leaving the labour force and staying home instead. And if these trends continue we should all be concerned, not just for this setback on the long march towards greater equality, but for the long-term health of our economy as well.

UPDATE: covered in the Toronto Star article by Sara Motjehedzadeh and republished by rabble.


Viewing all 76 articles
Browse latest View live


Latest Images