Quantcast
Channel: Labour Market – The Progressive Economics Forum

Self-Employment Masks Job Loss

$
0
0

Statistics Canada reported today that employers cut the number of employees by 98,000 in August, which was largely masked by 87,000 more Canadians identifying themselves as self-employed. As a result, the headline level of “employment” – which includes self-employment – was little changed.

Self-employment ranges from high-income professionals to people eking out a living doing odd jobs. However, when a large increase in self-employment coincides with a large drop in positions paid by an employer, it begs the question of whether Canadians are becoming self-employed by choice or because jobs are not available. One also wonders how many survey respondents are simply more comfortable reporting themselves as self-employed rather than unemployed.

The headline numbers are weak and they would be disastrous but for the surge in self-reported self-employment. Policymakers must focus on creating jobs and ensuring adequate benefits for jobless workers.


Terrible, Horrible, No Good, Very Bad Job Numbers

$
0
0

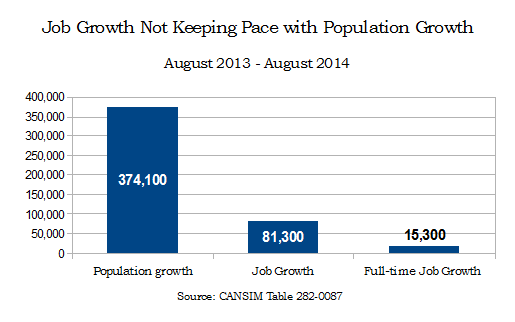
Today Statistics Canada released their first set of job numbers since the ‘oops’ of July 2014. And the news was dismal. The labour market shed 112,000 private sector positions, the largest single month drop in the private sector since, well, forever. Coming on the heels of a mistake is unfortunate, but you have to think that Statistics Canada was extra vigilant this month and checked everything up, down, backwards, and sideways.

Either way, month to month variations are far less meaningful than overall trends, so let’s have a look at those, shall we?

Part-time work

Only workers over 55 have seen an increase in full time work compared to last August, and most of this is likely due to demographic change. Among core age workers there were fewer full-time jobs and more part-time jobs. Young workers traded 3,000 full-time jobs for less than a thousand part-time ones.

Part-time

Source: CANSIM 282-0087

Temporary work

The picture is quite similar for temporary employment. Year over year, core age workers saw a drop in the number of permanent jobs, and an increase in temporary employment. Temporary


Young Workers

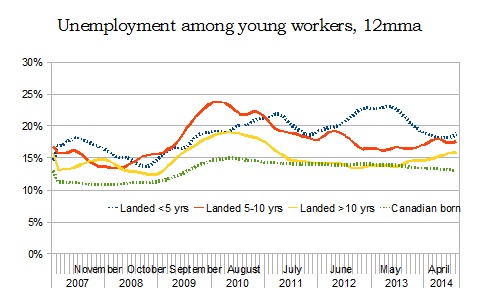
Young workers in particular have difficulty finding work when the labour market is slack. As do new Canadians. So it would follow that young workers who are also new Canadians have an even harder time. The graph below shows the unemployment rate for young workers as a 12 month moving average from January 2007.

At it’s peak, the unemployment rate for young workers who had been landed immigrants for 5 -10 years almost hit 25%. While the unemployment rate for Canadian born young workers remains elevated over its pre-recession level, the trend seems to be gradually falling. On the other hand, the unemployment rate is rising for all three categories of new Canadian young workers.

Source: CANSIM 282-0103

Source: CANSIM 282-0103


Public / Private mix

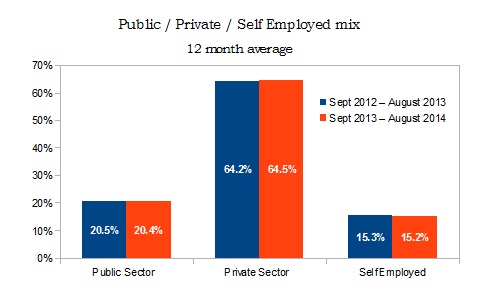
Such a huge drop in private sector employment is a concern, since the labour market has been very heavily relying on private sector gains for the minimal job growth we have seen this year. And the huge spike in self-employment is also worrisome, as these jobs are more often precarious ones.

The good news is that this months drop in private sector employment and spike in self-employment didn’t really change the overall mix when you look at the average over the past twelve months and compare this to the year before.

Source: CANSIM 282-0011

Source: CANSIM 282-0011


With far too few job vacancies, and record low proportions of unemployed workers receiving EI (especially in urban areas), the Canadian labour market is looking pretty depressing. I think there’s going to be a lot to discuss at Unifor’s upcoming Good Jobs Summit in Toronto.


Should Welfare Recipients Try Harder to Find Work?

$
0
0

This morning the Social Research and Demonstration Corporation released a new report about “motivational interviewing” for welfare recipients.  The link to the full report is here, and the link to the executive summary is here.

Authored by Reuben Ford, Jenn Dixon, Shek-wai Hui, Isaac Kwakye and Danielle Patry, the study reports on a recent randomized controlled trial done on long-term recipients of social assistance in British Columbia.  The research took place between September 2012 and March 2013.  There were a total of 154 research participants; 76 of the individuals were in the “treatment group,” while 78 were in the “control group.”

Earlier this year, I was invited to be a discussant on the study at the Annual Conference of the Canadian Economics Association.  Here are 10 things I think you should know about this report:

1. The “intervention” being studied was the Motivational Interviewing (MI) technique.  MI is “a method of interacting with clients who are ambivalent about making change in their lives.” It has “wide application in behavioural change: addictions, health, behaviour wellness, chronic disease management, and most recently in the employment field.”  For more on MI, see this web link.

2. Research participants were on welfare upon enrollment in the study.  By “welfare,” I mean last-resort social assistance.  For most eligible residents in British Columbia, this is known as “income assistance (IA).”  Upon being recruited for the study, most research participants were receiving approximately $1,000 per month to live on; this amount included “health supplements,” as well as “general supplements” for such things as transportation.  Research participants had also been identified by British Colombia’s Ministry of Social Development as being “employment obligated,” which means they were expected to be actively searching for paid employment.  (For more on benefit levels available under social assistance programs administered by provincial and territorial governments, see this 2013 report.  Readers should be mindful that, across Canada, there are separate social assistance systems for First Nations; a 2007 evaluation of the federally-administered “income assistance” program for First Nations can be found here.)

3. Research participants had been on welfare for at least one year at the study’s outset.  The rationale behind this recruitment strategy was to identify social assistance recipients who were most likely to be facing motivational challenges.

4. Most of the research participants reported health problems.  According to the report, more than 70% of study participants “reported activity limitations that affected their ability to work.” For example, just one-quarter of members of the treatment group reported that “their health was ‘good’ or ‘very good…'”  With this in mind, it’s not entirely clear to me why British Columbia’s Ministry of Social Development considers these individuals to be “employment obligated.”

5. The “intervention” was provided by welfare officials (specifically, by Employment and Assistance Workers and case managers).  Remarkably, each staff person received fewer than 70 hours of training before delivering the intervention (specifically, 60 hours of training in how to deliver MI and then nine hours of coaching as the intervention was being delivered).  The training of staff was provided by Empowering Change Inc., a Canadian-based organization that (perhaps not surprisingly) specializes in training people on how to deliver MI.  Members of the study’s control group “received the range of services and treatment which they would typically receive” as long-term recipients of social assistance.

6. The results of this study suggest that Motivational Interviewing can be effective.  By the end of the three-month study period, the difference in the respective employment rates of the treatment group and the control group was statistically significant.  The precise size of the difference in the employment rate between the two groups was 7.8%. (For the research wonks:  the level of statistical significance attained on this was 5%.  Put differently, the likelihood that this finding occurred by chance is less than 5%.)  This finding raises a question for me though:  what would outcomes have been for members of the treatment group after 12 and 24 months respectively?  Three months is not a long time.

7. Fewer than half of the members of the study’s treatment group actually took in even one (hour-long) Motivational Interviewing session.  Just 36 of the members of the study’s 76 treatment group members chose to go through with a Motivational Interview.  And only about one in five members of the treatment group took in more than one such session.  Ergo: the success of the treatment group as a whole appears to have been carried by a minority of its membership.  This suggests to me that the success of the treatment group is actually being understated; had every single member of the treatment group actually received the intervention (and not merely been offered it) I suspect the treatment group as a whole would have performed even more favourably compared with the control group.

8. The research was funded by Employment and Social Development Canada (ESDC).  On the one hand, I suspect that most readers will not be surprised to learn that the federal government wants most people on welfare to ‘look harder’ for work.  On the other hand, it may come as a surprise to some readers (especially those who remember the Harper government’s decision to end the mandatory long-form census) that the federal government has funded research looking at what is effective in this regard.

9. The study took place at a time when, throughout Canada, there were considerably more unemployed persons than job vacancies.  Across Canada there are roughly six unemployed persons for every job vacancy (a ratio that varies considerably across provinces).  This raises an important question:  in a country where the number of unemployed persons vastly outnumbers job vacancies, why does the federal government want to study the feasibility of long-term recipients of social assistance (many of whom have serious health problems) trying harder to find low-wage work?  Some readers will remember a Toronto study conducted in 2001 that followed more than 800 individuals who had left welfare within the previous year.  Fewer than half of those individuals “felt things had improved financially” for them since leaving social assistance; on the whole, after leaving social assistance, individuals “reported incomes at approximately 92% of Statistics Canada’s 2001 Low Income Cut-Offs.” (Further analysis of this Toronto study can be found here.)

10. This study took place at the same time that the federal government is aggressively bringing in more temporary migrant workers.  As Jim Stanford has recently noted: “Migrant employment [in Canada] rose 140 per cent between 2005 and 2012.” Further, “[o]ne in every five net new paid jobs created in Canada between 2007 and 2012 was filled by a migrant worker.” This raises yet another question for me:  why is the federal government interested in exploring how to encourage more welfare recipients to look harder for low-wage jobs while (simultaneously) ‘importing’ competition for many of those same jobs at an aggressive pace?  Don’t the two objectives work at cross purposes?

Of Rising Tides and Sinking Boats

$
0
0

Recently, Minister Kenney took to twitter to defend his decision to limit the number of precarious workers entering Alberta through the Temporary Foreign Worker Program. Again, the minister is to be applauded for his grasp of the situation. His changes do little to fix the actual problem though.

The evidence that he cited was the lack of wage growth among restaurant workers in Alberta. The graph below shows that, adjusted for inflation, restaurant worker wages in Alberta peaked in 2010, and have fallen since then by over $35 / week. At the same time, the overall average weekly wage has risen by $67 / week. Wages for retail workers haven’t budged, and manufacturing wages have risen only slightly.

Source: CANSIM 281-0027

Source: CANSIM 281-0027

What is driving this? Workers bargaining power has been restricted in two ways. First, workers employed through the Temporary Foreign Worker program are tied to a single employer. Second, many are not allowed to unionize. If a worker is unhappy with the wages or working conditions of their job, they can neither band together to demand better, nor walk across the street to a better employer.

The result is that employers do not have to raise wages to attract and keep workers. If there is a sufficient supply of vulnerable labourers, then current non-TFWP workers may be easily disciplined with the treat of being replaced by a willing temporary worker.

Limiting the pool of workers whose bargaining power is restricted may improve the situation of non-TFWP workers somewhat, if it means that they are less likely to believe the treat of being replaced. But it does nothing to improve the situation for temporary workers.

If there is a need for more low-skilled workers in Alberta, then Alberta should open up temporary and permanent immigration for low-skilled workers. But all workers should be allowed to move between employers, and to bargain wages and working conditions through the union of their choice. The best way to enforce employment standards is by giving workers the power to stand up for themselves.

Liberal’s EI Plan Rests on Bad Math

$
0
0

Joe Oliver recently announced a Small Business Tax Cut, sorry, Job Credit. Economists across the ideological spectrum denounced it as poorly designed.

This opened up an interesting opportunity for a national debate about what we want E.I. to be – coverage right now is at all time lows, and the accumulated deficit from the last recession will soon be repaid in full.

The Liberal Party entered the EI debate by suggesting a one-year EI premium holiday for employers who hire new workers. It’s disappointing that they completely ignored the possibility of expanding access. What’s even worse is that their plan rests on some pretty terrible math.

How much do they think a one year EI premium holiday for new hires will cost? Why, they can create 176,000 jobs for the low price of $225 million / year.

Sure, you say, the maximum EI contribution for employers is around $1250 / year, and 176,000 * $1250 = $225 million. No problem.

But, wait! How do you define new job? And how many ‘new jobs’ are created in the Canadian economy in any given year? You might think that it’s in the 176,000 range if you listen to any of the coverage of the Labour Force Survey release at the beginning of every month. But you’d be wrong.

The Labour Force Survey counts ‘net new jobs’, which is the the number of new hires minus the number of job leavers in a given month. Between August 2013 and August 2014, there was an average of 6,000 net new jobs every month.

But the total number of new hires is much larger than the number of net new jobs. People leave one job for another, and move into and out of the labour force regularly.

Although Statistics Canada doesn’t measure new hires directly, it does ask “how long have you been in your current job?”. We can say that people who answer “1 month or less” is a pretty good proxy for new hires. By this metric, there were approximately 3.7 million new hires in 2013. That’s 310,000 per month.

The Liberals will have blown through their annual budget for the EI premium rebate about two weeks after it has been introduced.

This plan confirms two things. The Liberal Party of Canada is totally OK with an EI coverage rate of 36%, and they aren’t really sure how the labour market works in Canada.

Labour market musings

$
0
0

Just a short post ahead of the job numbers that come out from Statistics Canada tomorrow. Five years after the end of the last recession, and Canada’s labour market is still limping along. And it seems to have taken a turn for the worse recently.

While the Conservative government crows about one million net new jobs, they conveniently forget to mention that we would need to add another 880,000 new jobs to the Canadian economy to catch up to our pre-recession employment rate.

On average, that’s about 73,000 jobs per month, every month, for a whole year. This is unlikely to happen given our current job creation trends. Over the past year, we’ve added fewer than 7,000 jobs per month, which is only about one-tenth of what we need to put unemployed Canadians back to work.

Growth

And as we always hear, demographics matter. Here’s what that chart looks like for men and women between the ages of 15 and 64.

demographics

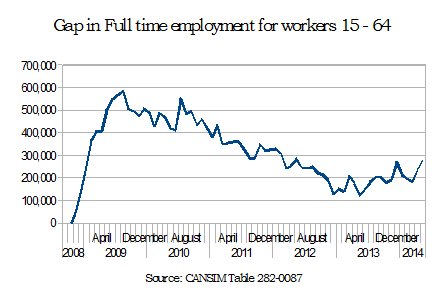
We’re short 300,000 full-time jobs for workers 15-64. In other words, in order for the employment rate of working age Canadians to return to its pre-recession level, we need to add 300,000 full-time jobs in that age category.

That’s half the number of jobs that went missing in the depth of the recession, but double where we were a year and half ago. The situation is getting worse, not better.

Gap


Another issue of growing concern is the continued high rate of long term unemployed workers (highlighted by today’s PBO report on EI).

CANSIM Table: 282-0047

CANSIM Table: 282-0047

Just a few things to keep in mind when you’re reading the labour market analysis tomorrow, whatever the monthly numbers say.

Job Numbers Surprise

$
0
0

For the first time in a while, Statistics Canada gives us some good news on the job front. 74,000 net new jobs added in September, certainly nothing to sneeze at. Still, we would need to keep this pace up every month for the next year to close the employment gap left by the last recession.

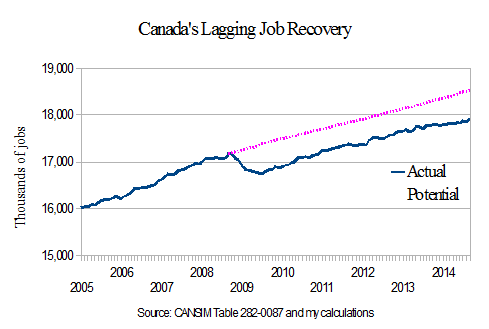
On the graph below, this month’s huge uptick barely makes a dent. The blue line is how many jobs we have, and the dotted pink line is how many we would have if the employment rate were 63.6%.

webpotential


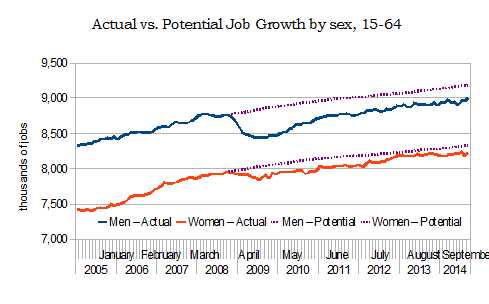
This holds true for workers age 15-64 as well, but in terms of total employment is a bigger issue for men (it is still a he-cession). The potential job growth lines (shown as dotted lines on the graph), are based on pre-recession employment rates. A year and a half ago, women were very close to their potential employment rate, but the trend has fallen off a bit since then.actualvspotential

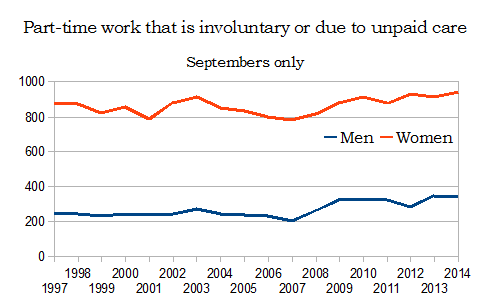
More women work part-time than men, for various reasons, but it’s often to accommodate unpaid care work or because they can’t find full-time work. The number of men and women working part-time involuntarily is higher this September than it’s been in a month of September since 1997.

invPT

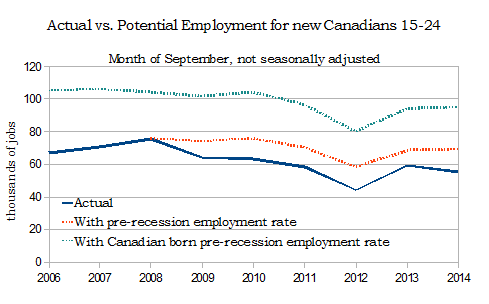
And for young workers who are new to Canada, there has been no recovery.  In the chart below I compare actual and potential employment for the months of September since 2006. To graph potential I use both the Canadian born young worker employment rate, and the new Canadian young worker employment rate.

actualvspotentialnewyw

Overall, recent immigrants have seen fewer jobs return. The unemployment rate for recent immigrants (less than 5 years) stood at 13.7%, compared to 6.5% for Canadian born workers. We don’t just need to create jobs, we need to create good jobs, and they need to be available to everyone.

Bank of Canada, Exports, and LMI

$
0
0

Much has been made about Stephen Poloz’s decision to abandon ‘forward guidance’ in Bank of Canada rate setting announcements for the time being. Critics bemoan the loss of direction from the Bank. But Poloz’s comments yesterday were chock full of guidance on how the Bank sees Canada’s economic situation.

Having been disappointed by the failure of Canada’s export sector to resume investment or show any signs of life, researchers at the Bank investigated the performance of 2,000 product categories, and found that about 500 of those had very nearly been wiped out following the 2008 – 2009 recession. Further investigation found a permanent loss of capacity in some manufacturing export sub-sectors. Most surviving manufacturing exporters are still operating at or below capacity. This means we shouldn’t expect a whole lot of business investment in these sectors any time soon.

This permanent loss of capacity isn’t truly permanent, we can rebuild, but doing so will take more time, and will wait until conditions are much more certain. This has disastrous consequences for workers, particularly in southern Ontario where much of the loss has been located.

Stephen Poloz’s statement is clear on this. The size of the output gap is somewhat deceptive because of this loss of capacity. A clearer picture of the weakness Canada is experiencing shows up in the labour market gap. Which the Bank very carefully measures, by the way. The Bank’s aggregate LMI diverged from the unemployment rate in late 2012. TD Economics put together their own aggregate labour market indicator, that also shows the labour market is weaker than the unemployment rate shows.

This might be the perfect time for some public infrastructure investment (as recommended by the IMF), say, in affordable childcare spaces.


Low Oil Prices, Good or Bad for Canada?

$
0
0

Unless you’ve been hiding under a rock somewhere, you’re probably well aware that the price of oil has fallen dramatically, to less than $50 / barrel. What this means for Canada’s economic output & labour markets is not yet clear. But Stephen Poloz at the Bank of Canada has said that he expects the effect to be “not trivial”, and suggested that it might lower the Bank’s GDP expectations by around 0.3 percentage points. Deputy Governor Timothy Lane’s talk on January 13th is good background reading on this topic, and overall he suggested that the effect will be at least somewhat negative for the Canadian economy. Other commentators have suggested that the lower dollar and the US economy’s pick-up will swamp any negative effects, leading to an overall positive effect nationally.

There are several reasons why I would side with the more pessimistic predictions. I also think that the policy response to a more pessimistic outlook is consistent with the policy response to medium and long term global constraints, such as climate change. Let me tell you why.

I’ve commented earlier on the Bank of Canada’s review of manufacturing capacity lost during the past recession, and the CIBC has put out a note on this as well. Avery Shenfeld and Andrew Grantham point out that significant capacity loss has been centred in manufacturing sectors that are sensitive to changes in the Canadian dollar (and therefore might be poised for a period of expansion). It takes much longer for business to respond to exchange rate signals when they don’t have existing excess capacity. Shenfeld and Grantham suggest that it could take several years of an 80 – 85 cent dollar before we saw a return to a vibrant manufacturing sector in southern Ontario. This is different than previous recessions, where Ontario had excess manufacturing capacity that could quickly respond to price signals.

Also, communities in Ontario and Atlantic Canada have depended on remittances from workers who either commute or move to Alberta for high -wage jobs in the tar sands or construction. These workers are likely to be laid off first, creating a drag on the economy that will be felt far outside Fort McMurray.

The other fear is that Alberta and the federal government will respond to lower revenues with more cuts, that will act as a further drag on economic growth. This would be the least effective response, but given current provincial and federal leadership, is also the most likely.

Rather than cross our fingers and hope for a manufacturing led recovery, I think that all levels of government, unions, and business need to think about what kinds of infrastructure we need to put in place to be ready for long term challenges. Governments especially should think about what kind of infrastructure would encourage new economic growth, rather than simply handing out funds to existing business.

A recent Nature paper suggests that negative economic impacts can be mitigated by taking early action on climate change. I think we’ve missed the boat on ‘early’, but sooner is always better than later. The earlier a jurisdiction can introduce a carbon pricing scheme (such as the one Ontario is expected to announce this year), the sooner businesses and individuals can adjust. This would give them a competitive advantage against firms in jurisdictions that are slower to respond to what is arguably an inevitable reality.

Let’s look forward to new challenges with new thinking. We’ll never dig ourselves out of the hole we’re in by using the tools that got us here in the first place.

Banks and Balanced Budgets

$
0
0

The Bank of Canada surprised most analysts this week when it decided to cut rates by 25 basis points. The move comes after the price of oil has tumbled below $50 / barrel, oil producers announced huge cuts to business investment for 2015, Target announced a mass layoff of 17,600 workers in Canada, and the International Monetary Fund warned of a global economic slowdown.

The key message of the January Monetary Policy is that the Canadian economy needs stimulus. The Bank’s view of the Canadian economy stands in sharp contrast to that of the federal government, which is intent on delivering a balanced budget with a basket full of family tax cut goodies. By spending their surplus before they had even secured it, and then also sticking to an unrealistic balanced budget timeline, this government painted themselves into a corner, and made themselves look very foolish.

Thank goodness that the Bank was willing to act, and put the wellbeing of Canadians over concerns of a housing bubble and excess household debt.

So, what was the biggest outcome of the announcement? The loonie fell to 81 cents USD, down nearly two cents on the day. It is now five cents lower than it was on January 1st. Since oil and other commodities are priced in US dollars, the lower loonie effectively boosts prices for Canadian commodities producers. For those that were operating at or just below their short-run cost margins, this is great news. According to the following chart taken from Timothy Lane’s remarks on January 13th, that includes several sites in Canada.

SRMarginalcostOil

While many analysts pointed to how this move was good for manufacturing, the most immediate impact of the Bank’s rate cut is to save thousands of jobs in the oil, gas, and mining sector.

As I’ve pointed out before, the benefit to manufacturing depends partly on the ability of existing manufacturing firms to grow. New entrants will be unlikely to rely on the lower dollar to stick around forever, but may be able to use the current cushion to get their projects off the ground. This will take some time. The lower dollar increases most machine and equipment input costs, so labour intensive firms actually have the advantage in the current environment.

The Bank issues its next rate announcement in March, and many observers are considering the possibility of another rate cut at that time. What is that likely to depend on? Well, the Bank based their estimate on $60 oil, and it’s currently below $50. The price is unlikely to rise until something gives on the supply side. Canadian and American producers are currently saying that their production will increase this year, just at a slower rate than last year. Saudi Arabia seems intent on keeping supply high until it forces some of those North American producers out of the market. If the price of oil stays low for the next couple of months, we could easily be looking at yet another cut from the Bank. Would it be enough for Stephen Harper to give up on a balanced budget? That’s a tougher question.

Rochon Asks: “Is the Canadian economy unraveling?”

ROCHON: Harper in closet over the economy as Canada heads toward another recession

$
0
0

This guest blog post has been written by Louis-Philippe Rochon.

You can follow him on Twitter @Lprochon

Harper’s recent incarnation as an anti-terrorist crusader has caught many Canadians by surprise. Harper is spending considerable political energy beating the drums of war against terrorists, and introducing a far-reaching, and much condemned, bill aimed at restricting free speech, and increasing police powers. But could this move hide a more cynical purpose? Can there be an ulterior motive?

I think there is, and the reason is quite simple. It’s the economy. Seven years after the beginning of the crisis, and 4 years after the official end of the crisis, the economy is slowly (or not so slowly) heading in the wrong direction. In fact, I don’t think we can exclude the possibility of a recession late in 2015 or early 2016.

Consider the economic facts. In 2014, the Canadian economy had a rather weak year. In November, the economy actually contracted by 0.2% mainly as a result of a weak manufacturing sector. It is the economy’s worst performance in almost a year: on a year-over-year basis, growth in Canada slowed to 1.9% from 2.3% in November.

As for the labour market, unemployment is up, and job creation is down, and we are still nowhere near pre-crisis levels. In Statistics Canada’s labour market revisions last week, unemployment rate inched upward to 6.7%. Moreover, the Canadian economy in 2014 only created 121,300 jobs and not the 185,700 jobs initially reported. That’s an enormous discrepancy, a 35% discrepancy to be exact. On top of that, the economy actually shed jobs in the last 2 months. As for the labour force participation rate, it now stands 65.7% (revised down from 65.9%). Right before the crisis, it stood at roughly 67.7%. At this point in the recovery, we should be doing much better.

The recent decline of the loonie could be seen in some positive light, because it may lead to an increase in exports especially in vote rich Ontario and Quebec, but for this to occur, our trading partners’ economies must be growing at some respectful rates. And I am thinking here more of the US and China.

Everyone is predicting strong growth in the US economy in 2015, yet after growing at close to 5% in the 2nd and 3rd quarters of 2014, the US economy has slowed down to 2,6% in the 4th quarter (lower than expected); in fact the 2013 Q4 to 2014 Q4 growth rate was only 2.5%, which is less than the 3.1% recorded in 2013.   Now, just released, November’s US trade deficit is up, and there are expectations that December’s growth rate will come in below 2%.

In November, Canada’s manufacturing sector shrank by 1.9% even though our dollar was falling. This was a surprise to market observers who were expecting a slight upward bump.

And then, there is the question of our monetary policy. The Bank of Canada’s Hail Mary reduction in interest rates a few weeks ago (in an international beggar-thy-neighbour poliy, it seems) was a clear admission of the malaise creeping into the economy.

And now, the yield curve, a spectrum of yields on bonds of various maturities, has inverted. As of last week, the return on 5-year bonds fell below the overnight rate of 0.75. Now this is a big deal and it does not happen often. This is a sign that markets are factoring in another decrease in overnight rates, and reflects a general uneasiness about the direction in which the Canadian economy is going.

In fact, in some research of the US economy, it has been shown that a yield curve inversion more often than not announces a recession possibly as early as 6 to 9 months later. Yield curve inversions are usually followed by a credit crunch, where banks are more reluctant to lend, and the economy slows down. If this view holds, then we could possibly be looking at a recession in Canada anytime in between July and October – smack in the middle of a federal election campaign!

With his economic cards on the table, Harper’s hand is proving to be very weak. In order to win an election, he must create momentum, but the state of the economy won’t give him this opportunity. Note how silent the PM has been lately on the economy.

Armed with the same data, his advisers are surely telling him to avoid talking about the economy. So if you are the Prime Minister who has prided himself on strong economic policies, who has boasted his government’s record on prosperity, what can you do?

Well, the answer is simple: change the channel. In other words, redirect the debate toward something else, something that will hopefully distract the voters. But this issue must be big, something so terrible in fact that no one will even remember that the economy is heading in the wrong direction.

Enter the war on terrorism. Perfect topic. After all, who is not in favour of fighting terrorism? Harper will surely paint all those against him as terrorist sympathizers, and the opposition has fallen into the trap. And the timing could not be better: Parliament Hill in Ottawa just got attacked, and so were the offices of Charlie Hebdo in Paris. So let’s strike when the iron is hot.

Unfortunately, voters’ attention span is limited, and even the war on terrorism cannot be sustained for a whole 8 months. So expect Harper to do the next best thing: call an early election. This will serve two purposes: keep the terrorism debate alive for a much shorter time, but also avoid the unpleasant and inconvenient discussion of what is happening to the economy, and face the electorate when the economy gets too obvious that it can no longer be ignored.

It will be up to the Opposition parties to keep the economic topic alive, and Harper will try everything to avoid talking about it.

January Job Gain Part-time, Self-employment

$
0
0

As usual, the monthly Labour Force Survey numbers headline seems to tell a different story than the underlying numbers. According to the LFS, Canada added 35,000 jobs in January. A statistically significant number of jobs, hurray!

But wait. Those were all part time jobs. We lost 10,000 full time jobs, and added 47,000 part-time jobs.

Oh, and they were all through self-employment. We lost nearly 6,000 jobs, but 41,000 Canadians entered the labour market through self-employment.

In fact, compared to last January, half of all employment growth was through self-employment, with an increase of over 68,000 self-employed workers. The overwhelming majority of those workers  were in the most precarious self-employment category – unincorporated with no paid help. Between January 2014 and January 2015, there was an increase of 53,500 self-employed workers who were unincorporated with no paid help. (All of this data is not seasonally adjusted).

Another sign of concern is the number of involuntary part-time workers, discouraged workers, and those waiting for jobs that start in a couple of months.

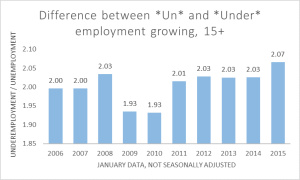
The underemployment rate has fallen by less than the unemployment rate has. This is most clearly shown by calculating the ratio of the two. Using seasonally unadjusted data, and comparing the last ten Januaries, the ratio of underemployment to unemployment is markedly higher in January 2015.

Underoverun


All of this points to underlying weakness in the Canadian labour market, on top of bleak prospects for the near term. The mayors are meeting in Toronto this week, and asking for stable funding to build much needed infrastructure. The weakness in the labour market is just one more reason that the federal government should listen very closely to what the mayors are asking for.

Why are women leaving Canada’s workforce?

$
0
0

I started producing an e-weekly earlier this year, Eye on the Economy: making sense of recent economic events, as a more regularly complement to the quarterly Economy at Work I also produce.

Each issue contains a main commentary/analysis piece on a topical issue and also a curated round up with about five shorter briefs.  In an age of info overload and never ending tweets, it’s meant to provide a decent summary of relevant economic events.

The main piece from a few weeks ago, on “Why are women leaving Canada’s workforce?” is relevant with international women’s day this weekend.  For me, it’s also a bit of a puzzle — and I’d appreciate comments on this from readers of this blog.

If you’re interested, please sign up here to receive it.  I’ll try and repost relevant here, but I’ve been lousy at doing it so far and can’t guarantee I’ll have the time!

———————————————–

Why are women leaving Canada’s workforce?

Women left Canada’s labour force in record numbers last year. Who are they and why did they leave?

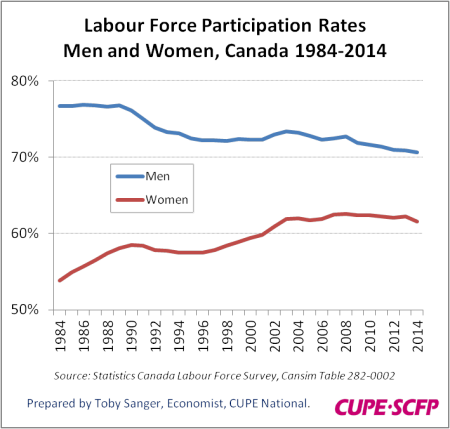
Over 80,000 women left Canada’s labour force in 2014, bringing their labour force participation rate down to 61.6 per cent from 62.2 per cent in 2013 (all figures annual averages). This is the lowest rate since 2002, and a reversal of decades of gradually growing gender equality through women’s participation in the workforce.

Historical LF partipication rates

If women’s participation rates hadn’t declined in 2014, the unemployment rate for women unemployment rate would have risen from 6.4 to 7.3 per cent. This would have been the highest annual rate in 15 years and even higher than it was during the 2009-10 recession years.  While there was a decline in women’s labour force participation immediately following the recession of the early 1990s, the decline last year comes five years after the recession was supposedly over.

The exodus is concerning for a number of reasons. Women, their household incomes and public revenues will all lose out from lower incomes. If women are leaving the labour force because of a lack of opportunities, inadequate pay or because they are overloaded with work and family responsibilities, it should also be a major concern.

Lower labour force participation will also put a damper on long-term growth of the economy, which is a reason Canada together with other G20 nations agreed last November to set a goal of narrowing the gender participation gap by 25 percent by the year 2025. Just a few months into this commitment and Canada’s gap in women’s participation rates has widened rather than narrowed.

Part of the overall decline in participation rates is due to population aging: as a greater share of the population enters retirement age, participation rates naturally decline. But while this explains the drop in men’s participation, it doesn’t explain the greater drop for women. The biggest declines in workforce participation have been for middle-aged women aged 40-54.  It’s also not a regional story. For the first year since at least 1977 participation rates for women dropped in every single province in Canada last year.

So what explains this exodus of women from the labour force?

It isn’t because women are retiring early because they can afford to on their own. Occupations with the greatest decline in female employment were clerical (-36,000); trades, transport, equipment operators and construction (-14,000); professional occupations in health such as nurses (-16,000); and middle management (13,000). Most of these aren’t higher paid occupations with early retirement benefits.

The industries with the biggest declines of women in their workforce in 2014 were manufacturing, trade, transport, finance and insurance, business and support services, and other and unclassified services. In total the female labour force declined by more than 80,000 in these industries, while the male labour force increased by an almost identical amount in these same industries. Employment trends in these industries follow a similar pattern.

LF gains n loss by industry

The decline in women’s labour force participation wasn’t the result of an overall decline of employment in more female dominated industries, as some have suggested. On the contrary, labour force and employment levels of women in the most female dominated industries—education, health and social services and accommodation—all increased, while declining in the more heavily male-dominated industries. This means despite all the promotion of women in non-traditional occupations, Canada’s workforce became even more divided by sex last year.

Other explanations recently offered also come up short. While fertility rates have risen for older women, they’ve been more than offset by declining fertility rates for younger women, so this factor shouldn’t explain an overall decline in participation rates for all women. The rising share of landed immigrants with lower rates of labour force participation only explains about a tenth of the total decline in women’s labour force participation last year: participation rates declined at an equal rate for women born in Canada as for immigrant women.

Clearly we need to look elsewhere for explanations.

Countries with higher pay gaps for women also tend to have lower female participation rates. Higher child care costs and family caregiving demands for elders and other dependents also significantly reduce women’s labour force participation. More and more workers are also feeling overloaded: 60 per cent of respondents to a Globe and Mail survey reported feeling stressed and on edge at work.

There’s been very little progress in reducing pay gaps for women. In fact the gap has increased in recent years. The Harper government’s economic policies have focused heavily on male-dominated construction, resource-extraction and military-security industries and tended to emphasize more traditional family values. The lack of support for affordable childcare and introduction of tax measures that increase incentives for women to stay home may also have an impact.

Together, these economic and social factors could be the reason why more women are leaving the labour force and staying home instead. And if these trends continue we should all be concerned, not just for this setback on the long march towards greater equality, but for the long-term health of our economy as well.

UPDATE: covered in the Toronto Star article by Sara Motjehedzadeh and republished by rabble.


ROCHON on: A tale of two economies? Making sense of recent US and Canadian labour market data

$
0
0

Louis-Philippe ROCHON

Associate Professor, Laurentian University

Co-Editor, Review of Keynesian Economics

Follow him on Twitter @Lprochon


With data on the performance of Canada’s labour market released today, many economists and pundits on both sides of the 49th parallel are arguing that what seems to be emerging is two very clear and different paths for the US and Canadian economies. But that interpretation is not exactly correct.

Indeed, the US economy seems to be outperforming expectations, according to labour market data released last week, according to which the labour market is showing continued strong signs of life. In February alone, the US economy added more than 295,000 jobs, making it the 12th month in a row where monthly job creation is at least 200,000.That seems quite remarkable, especially since job creation is widespread across all sectors and demographics, suggesting a firmly-rooted recovery. Moreover the unemployment rate has shrunk to 5.5%, which is where it stood in May 2008. Finally, as the Secretary of Labor, Thomas E. Perez, boasted last week, February marks the first time in more than 3 decades, unemployment fell in all 50 states.

What more could you say? Apparently, the US is on course for a strong growth spurt, fuelling fear of inflation, which may convince the Federal Reserve to raise interest rates sooner than expected.

But we mustn’t believe everything the man behind the curtain is saying. As always, statistics can be used to spin any good story. A closer look reveals a somewhat different story, and in fact, a story that is much closer to our own. In the end, both the US and Canadian labour markets are much closer in character than most pundits would care to admit.

Since unemployment rates by themselves do not tell the whole story, we must dig deeper to get a fuller story.

First, there is still too much part-time employment, and the current employment ratio (the ratio of employed individual to the overall labour population) is still low, at 59.3%, a full 3 points below where it stood before the recession (labour participation rate sits at a low of 62.8%). This means that there is still an important number of workers who still desire full time jobs but just can’t get them, and left the labour market discouraged.

As American economist Thomas Palley wrote recently (see here), close to 22 million American workers are still looking to work more. Clear evidence, he says, that the US is still far away from full employment. In fact, Bucknell University professor Matias Vernengo, argues (see here) that if participation rates were at the same level today than at the end of the Clinton boom years (67%), unemployment rate today in the US would be close to 12% and not 5.5% Now that’s a difference story indeed.

And then there is wage growth, which remains relatively weak. In fact, wage increases have averaged 0.01%, well below January’s 0.5% gain. So wage gains may in fact be slowing down. More importantly, February’s paltry wage gain is still way below productivity gains, which means there is no threat of inflation any time soon or on the horizon.

This brings us to economic policy. It is now widely expected that the US Federal Reserve will begin raising interest rates, and possibly as soon as June if not earlier. But would this increase be justified.

Given the relatively weak labour market still, and the lack of any inflationary pressure (some pundits see the inflation threat everywhere), a rate hike now would seem to be premature.

All this brings us back to Canada.

Recall that in January, while labour markets created more than 35,000 jobs (although I expect those numbers to be revised downward), these were all part-time and self-employment, thereby emphasizing the rather precarious nature of Canadian labour market. This followed a December where the economy actually shed jobs.

The latest job numbers for February are far from encouraging. In February, the Canadian economy again shed jobs, albeit less (1,000), but the unemployment rate increased back up to 6.8% from 6.6%. As I said before, we are heading in the wrong direction.

But there is more. I calculated the real rate of unemployment. If the labour force participation in Canada were at the same level as at the beginning of the crisis, then Canada’s real unemployment rate would be closer to 9% today.

This is as far away from full employment as we can get.

It is becoming overwhelmingly clear that both economies are suffering considerably, and both economies are still far from a sustained recovery, although Canada’s economy is doing far worse.

The Federal Reserve should not be raising rates. This is not the time. In both countries, what we need is fiscal stimulus and massive investments in public infrastructure. Unfortunately, ideological and political nearsightedness will prevent that from happening, virtually guaranteeing a prolonged period of misery.


Transforming Precarious Work

$
0
0

The Ontario government has launched a review of their Labour Relations Act and Employment Standards Act. The premise is that the workplace has changed, and Ontario labour law no longer does as much as  it should to protect vulnerable workers.

The Workers’ Action Centre in Toronto took this opportunity to document the myriad ways that workers are left behind, and make 47 concrete recommendations to improve legislative protections.

What’s unique about this report is that worker’s voices are central. Throughout the report links are made between the lived experiences of workers, current labour market statistics, and thoughtful recommendations to make workers’ lives better.

One huge problem in precarious work is the downloading of risk to workers. This is done through just-in-time scheduling, overuse of part-time and temporary employment relationships, and employee misclassification. Too many “workers” are classified as self-employed, and this practice has spread into a surprising number of sectors.

A 2010 review of the construction sector in Ontario found that misclassified independent contractors cost the province $1.4B to $2.4B in WSIB, income tax, CPP, and EI payments. This doesn’t even begin to touch on the lost wages and benefits to workers. The Workers’ Action Centre report offers suggestions that put the legal onus on an employer to prove there is no employee / employer relationship, which could help stem this trend in precarious work.

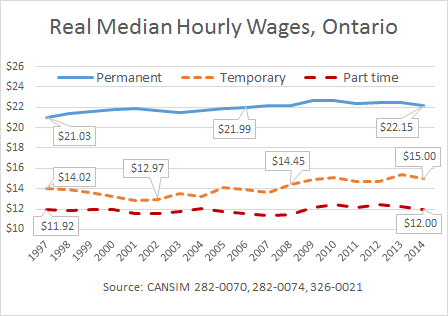
Another key issue highlighted by the report is “Equal Pay for Equal Work”. One might be forgiven for thinking that this has to do with the gender wage gap (well, it’s related, as we’ll see). Workers in temporary and part-time positions earn far less money than their permanent full-time counterparts. Workers in temporary positions tend to be young workers, women, and racialized workers (which is a factor in the gender and racialized worker wage gap).

This answers the question of why we care about part-time work when the vast majority of workers ‘choose’ to work part-time. It’s because part-time and temporary workers are overwhelmingly low wage, and along with that tend to have much weaker bargaining power in all aspects of their employment.

ONTwages1


I absolutely encourage anyone who is putting together their own organization’s response to read this report, and to support the recommendations found within. Precarious workers are counting on us to make sure the Employment Standards Act recognizes their lived reality. This is not only a show of basic solidarity, but the base upon which all worker’s protections stand.

The Harper Record on Jobs, 2006 to 2014

$
0
0

Here is the link to a short study I have done for the Broadbent Institute on the Harper Record on Jobs from 2006 to 2014 based on annual averages from the Labour Force Survey.

Coverage in today’s Toronto Star is here.

The basic findings, that there is still a lot of slack in the job market compared to the pre recession period (especially for youth) and that there has been a heavy tilt to part time work (one in three of the new jobs), will come as no surprise to readers of this blog.

What I found a bit more surprising is that 38% of the new jobs created 2006 to 2014 were in the lowest paid occupational category – sales and service jobs – and a lot of the good jobs created (35%) were in public sector occupations. Table 4 provides a lot of detail.

The Harper government claims that “since the depths of the recession, we have created more than 1.2 million net new jobs—overwhelmingly full-time, good-paying jobs in the private sector.” They hide their poor record by using the bottom of the recession as the starting point, and clearly if we look at their tenure as a whole the tilt is NOT to well-paid private sector jobs.


ROCHON on the IMF and labour market deregulations

$
0
0

LABOUR MARKET DEREGULATIONS NOT WORKING: IMF

See original CBC column here.

Recent — and potentially watershed — International Monetary Fund (IMF) documents have cast doubt on the merits of labour market deregulation of the last three decades, with important consequences for Canada. But will anyone listen?

The last 30 years have not been kind to economic growth and wealth creation.

The economic “successes” of the neo-liberal era, from roughly 1980 to 2007, pale in comparison to the three decades that followed the Second World War with respect to almost every economic variable imaginable.

One of the core arguments of the neo-liberal era, adopted at one time by the IMF and the World Bank, among other institutions, has been a belief in what economists have called labour market flexibility.

Labour market flexibility is aimed largely at making wage settlements more difficult and less generous, labour force reductions easier for the private sector, and labour union participation more difficult.

According to this argument, in a growing competitive global environment, Canadian companies have to remove any inefficiency in the labour market, especially any that could stifle the private sector’s quest for flexibility and profits.

So efforts have taken place over the last three decades to make labour markets more flexible: A push toward term or temporary contracts, a de-emphasis on job security, laws that made participation in unions more voluntary. And the Harper government has been an active and willing participant in this misplaced quest for labour market flexibility.

The private sector labeled labour unions as disruptive and detrimental to their bottom line: Wage gains were too high and unions too powerful, thereby making it too difficult to “restructure” hiring practices to make Canadian companies competitive (a fancy way to say it was difficult to fire people).

In reality, of course, this was an awful idea in terms of economic theory and economic consequence. In terms of building social peace between labour movements and the private sector, it was no good, either. The attack, however, has been carried out largely on the backs of working Canadians. And now we have proof.

In twin reports, the IMF revisits the question of the success of these policies.

In what can only be labeled a gigantic mea culpa, the IMF now claims that these policies have failed — and miserably, at that.

In two reports, the IMF carefully lays out the empirical evidence and it ain’t good.

In one of them, dated March 2015, the IMF argues that the decrease in unionization rates has largely fed the increase in incomes of those at the top.

Subsequently, for its April 2015 edition of the World Economic Output (WEO) report, which featured data from 16 G20 countries, the IMF concludes that there is no evidence that the neo-liberal deregulatory reforms had any positive impact on labour markets and economic growth.

These painful deregulatory policies, often imposed by force, have had no impact on total factor productivity.

It took courage for the IMF to arrive at these conclusions, and it reminds me of John Maynard Keynes, who famously once said, “When the facts change, I change my mind. What do you do, Sir?”

To its credit, the IMF looked at the evidence and admitted they had been wrong.

The IMF reports are just some in a series of recent reports from reputable institutions casting doubt on the whole neo-liberal era. Some of us have been arguing these same issues for years, concluding this era was one colossal failure, not only for the economy as a whole, but also for workers and their families.

In a recent report echoing the IMF findings, the Economic Policy Institute in Washington argued that there is a direct correlation between the decline in unionization rates in the U.S. and the decrease in the share of income going to the middle 60 per cent of working Americans (more or less, the middle class).

Evidence against the panoply of policies imposed on developed and developing countries over the last three decades is growing.

This requires a full rethinking of economics and economic policies, which is already well underway in many countries, led in many instances by students disillusioned with the teaching of economics. For instance, I have just returned from a conference in Vienna hosted by intelligent students looking for better solutions, and attended by over 200 students.

Many political parties in power, however, still refuse to acknowledge these findings, and continue with the same policies that largely contributed to the 2007 crisis.

It’s time we demand an end to policies that work against working Canadians, and in the process, we must demand from our governments better policies that share gains more broadly.

Louis-Philippe Rochon is an associate professor of economics at Laurentian University in Ontario, and the co-editor of the Review of Keynesian Economics.

The Myth of STEM Degrees: STEM as the Canary in the Coal Mine

$
0
0

What follow is a guest blog post from Glenn Burley:

If Science, Technology, Engineering and Mathematics (STEM) and professional fields like medicine, law, and dentistry are the so-called golden ticket to a good job in today’s labour market, what does that say about the current and future health of our economy?

The myth of the ‘skills gap’ in Canada is persistent. Along with increasing levels of student debt and a labour market in which good jobs are increasingly hard to find—especially for young people—this myth leads public discussion on employment to blaming individuals for their education choices. According to some, the only way to secure a decent job and address the labour market’s ‘skills gap’ is by studying in STEM fields.

Despite numerous contradictory reports, and even a degree of government back-pedaling, the skills gap narrative continues to hold considerable weight in public discourse. Most attempts to dispel the myth focus on general employment trends, noting a lack of wage evidence for a shortage of these qualifications, but not heavily focusing on the wage story.

The myth is also driving post-secondary education policies under the guise of encouraging students to study in fields that will “guarantee good jobs and high wages” and is used to justify significant year over year increases to tuition fees in STEM and professional programs (law, dentistry, medicine, etc.). In an attempt to dispel this myth, let’s tackle both arguments by looking at the actual wages these fields have earned from 1997 to 2013, as this was the largest set of data available at that time from the Labour Force Survey (LFS).

I relied on custom LFS data, which provided the median hourly wages for the most specific and closely related National Occupation Classifications (NOC-S), from 1997 to 2013 to the STEM and professional fields I was interested in:

  • C01: Physical Science Professionals
  • C02: Life Science Professionals
  • C03: Civil, Mechanical, Electrical, and Chemical Engineers
  • C06: Mathematicians, Statisticians, and Actuaries
  • C07: Computer and Information Systems Professionals
  • E01: Judges, Lawyers, and Quebec Notaries
  • D0-D1: Professional Occupations in Health, Nurse Supervisors, and Registered Nurses (more focused data for doctors and dentists were not available)

Starting out, I assumed both that incomes in STEM fields would be increasing fairly consistently and that these increases would be surpassed somewhat by increases in tuition fees. While I was largely correct in the tuition vs. wages assumption, it turned out the wage data on its own tells some very interesting stories.

Three clear points have emerged from the data:

  • Tuition fee increases are outpacing wage gains
  • There are cases where STEM and professional fields have seen their wages decrease when adjusted for inflation
  • Income inequality within the STEM and professional fields is very significant, but the general narrative about these fields assumes that everyone ends up in the top 10%

Taken as a whole, I believe the data show that the push for more STEM degrees is not only exaggerated, but highlights the poor short-term and long-term employment prospects for Canadian youth.


Tuition Fees

As public funding for post-secondary is eroded, the costs have been downloaded onto individuals through user fees. In most provinces, tuition fees increase annually at rates well above inflation for STEM and professional programs.

Between 1997 and 2013, tuition fees for these programs increased by between 38% (general science) and 202% (dentistry). These figures are national averages that have been adjusted for inflation.

Tuition fees in math and technology remain among the lowest in the fields examined (59.4% increase), mainly due to their more ‘core’ nature. Engineering, with one foot in the STEM pool and the other in the ‘professional field’ pool, has seen larger increases (69.8%) than the other STEM fields, but not nearly as much as other professional programs.

Medicine, dentistry, and law, with their largely unregulated tuition fees, have seen unparalleled increases. In 2013-14, the national average for a year of law school was just over $10,000 (up 156.4%); a year of medical school was over $12,000 (up 137.7%); and a year of dentistry school was over $17,000. These figures do not include ancillary, lab, or equipment fees, which can be upwards of $10,000 per year at some schools; let alone the cost of living.


Wages Since the Recession

We still often hear that if you get a STEM degree, you’ve got a golden ticket in today’s economy. Professional fields are generally thought of as safe ways to earn high salaries. These ideas are used to excuse ever-increasing tuition fees for these programs, because—the argument goes—it’s no big deal, you’ll more than earn it back!

The reality is that, since the recession, wages in these fields are not that golden.

In the physical sciences, national median wages have increased by an average of 11.9% when adjusted for inflation. However, this figure hides two of the most surprising figures I encountered: Since 2008, median wages in the physical sciences have decreased in both Alberta and British Columbia, by 2.5% and 21.4%, respectively.

The changes to the national median wages for the remaining fields examined, from 2007 to 2013 (pre-recession), and 2008 to 2013 (during the recession), adjusted for inflation are as follows:

  • Life Sciences: +1.2%, +2.8%
  • Technology: -0.5%, -0.4%
  • Engineering: +6.3%, +8.8%
  • Math: +35.8%, +21.4%
  • Medicine: +6.1%, +4.2%
  • Dentistry: +6.1%, +4.2%
  • Law: +6.8%, +8.1%


Wage Inequality

Stagnation and decreases in wages since the recession don’t necessarily mean the wages are low. The Canada Job Bank, which uses outdated information, provides a low, median, and high wage point for employment classifications used in the LFS. The ‘low’ refers to the 10th percentile, median is the 50th, and ‘high’ is the 90th.

While not perfect, let’s consider the 10th percentile (a.k.a. low wage, a.k.a. median of the bottom 20%) as an “entry level” wage. Unsurprisingly, these “entry-level wages,” both at national and provincial levels, are much lower than the wages that get talked about as part of the “golden ticket” narrative.

In 2013, “entry level” wages for these fields ranged from a low of $36,380 in Life Sciences to a high of $58,874 in Math. If someone graduates with above-average student debt, wages in this range can get a person close to qualifying for the Repayment Assistance Program—the program designed by the Canada Student Loans Program to help graduates who have difficulty repaying their loans.

Median wages at the national level ranged from a low of $67,787 in Physical Science, to a high of $115,850 as a Doctor/Dentist. While aligning a little more closely with the public narrative, even the median wages in these fields can come up well short of the “advertised” promise.

The most notable finding was just how far the top 10% of earners in the fields were from even the median earners. The top 10% of wages in the fields ranged from $113,790 in Life Sciences, to $340,917 in Medicine/Dentistry. While these wage figures are much more in line with the promises being made to young Canadians, they are obviously far from the norm.

When the high wages were compared to the median wages, the level of wage inequality is quite apparent. In Law and Technology, high earners earned approximately 58% more than median earners, and had the lowest level of inequality. At the other end, high earning dentists and doctors earned 194% more than the median.

Not only is the narrative misleading young Canadians into thinking they’ll walk into top earning wages in their field, it fails to mention that those top wages are far from the reality for the majority of workers in those fields.


STEM as the Canary in the Mine

After reviewing the data, I was left with a question: if these fields are truly the best fields for young Canadians to enter, what does that say about the state of our economy?

In almost all of the fields examined, wage decreases since the recession are visible in at least one province—and in one case, the national median has decreased. In almost all cases, this misleading narrative advertises a wage that is only earned by people in the top of the field. In almost all cases, income inequality within the field is significant.

With the increasing costs needed to get the credentials to enter these fields—not to mention that some of these fields require graduate degrees to obtain some of the best-paying jobs—and with the growing prevalence of precarious employment, a troubling trend becomes evident.

Based on the data, it’s becoming clear that we may have more than a “skills gap” myth to dispel; we may have an “economic recovery” myth as well.

Canada: World’s Next Superpower? Only If We Stop Relying On Temporary Foreign Workers

$
0
0

It’s only been a couple of weeks since Disney, that most iconic of American companies, moved to displace all its home grown techies with low-cost foreign temporary workers. But the company had to beat a hasty retreat in the face of an outpouring of criticism.

Amid the deluge of commentary this story triggered about where America is headed, blogger and finance professor Noah Smith turned his eyes north and gave Canada a mighty shout-out in a column for Bloomberg, Canada: Tomorrow’s Superpower.

Professor Smith rightly pointed out that, among the attributes that will make any nation great in future, immigration policy is key. But in his haste to explain what’s right about Canada’s policies, he skipped over the part of the story where we’ve begun to ape what’s wrong about the American way: a growing reliance by business on temporary “guest” workers.

Canada’s immigration reforms have pivoted from family reunification to economic immigration, with a focus on new permanent residents who have high educational skills and/or high net worth.

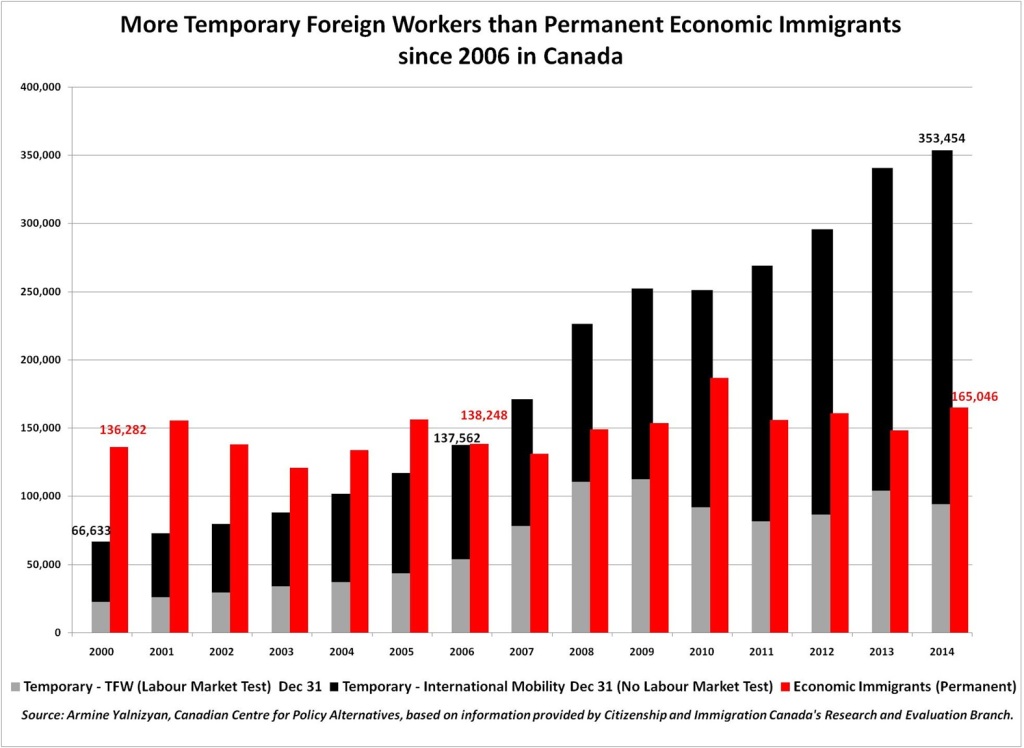
What most people don’t realize is that our intake of foreign workers has almost doubled since 2006—right through the recession, amidst rising unemployment rates, and with no recovery for young workers.  But almost all of the net new growth is driven by the escalating use of temporary foreign workers, not permanent economic immigrants.

More Temps than Permanents since 2006


Canadian businesses have turned to these workers for a variety of reasons, including legitimate shortages in certain pockets of the labour market, inadequate workplace training, and a desire to cut costs.

The Disney story that so riled Americans is almost a perfect mirror image of a 2013 story that alarmed  Canadians about practices at the Royal Bank of Canada. We’ve since learned the hiring of temporary foreign workers is a routine thing at Canadian banks and far beyond the finance sector.

The distinction between policies that encourage permanent or temporary newcomers is critical to Canada’s future and the future of a world dogged by population aging.

All the advanced industrialized nations are aging. Japan is first, but South Korea and China, and virtually every European country, are right behind. Canada is among the most rapidly aging societies because of our relatively large postwar baby boom.

Our labour shortages, now limited to booming pockets of the economy, will become endemic as baby boomers retire in droves, which will happen long before the robots take over.  In the meantime, economic migrants are becoming the tail that wags the dog of economic development and the evolution of nations.

Recently, the UN Refugee Agency noted that 59 million people were displaced in 2014 by violent conditions where they live, the highest number of displacements on record, and the fastest single year of growth.  These numbers do not include the displacement of peoples because of climate change, which is a growing phenomenon as well. Nor do they include rising numbers of international students and professionals who go abroad to seek greater opportunity.

Pushed or pulled, people are on the move as never before. So is capital.

For the last three decades, nations have tried to become magnets for money, in the hopes of drawing investments that create growth and jobs. For the next three decades, nations with aging populations will need to be magnets for both capital and labour, just to maintain standards of living.

The stakes are high. We are establishing the terms of the game for decades to come, for migrant workers and citizens alike.

There is perhaps no more fundamental test of policy success or failure than how labour force needs will be met in the coming years.

Will newcomers be invited in as “guest” workers or as citizens-in-the-making?  This is a new issue for Canada, and an increasingly contentious one.

Numerous policy announcements meant to quell concerns have done little to change the trends. No one has answered the core question: Why are temporary foreign workers good enough to work, but not good enough to stay?

Professor Smith is right — Canada has the potential to become a superpower, a country the world regards with respect and envy for its economic, social and political strength.

But it won’t get there by relying on the permanently temporary.


This piece was first published in the Globe and Mail on July 6, 2015 (July 7 print edition).

Armine Yalnizyan is senior economist at the Canadian Centre for Policy Alternatives, and business columnist for CBC Radio’s Metro Morning. You can follow her on twitter here.

Dix Choses à Savoir sur l’Itinérance au Canada

$
0
0

Cet après-midi, j’ai fait une présentation au Child & Family Homelessness Stakeholder Summit, organisé par Chez Toit, à Toronto. Ma presentation, illustrée de diapositives, peut être téléchargée ici. Pour accompagner la présentation, je vous ai préparé la liste suivante: « Dix choses à savoir sur l’itinérance au Canada. »

1. Les tentatives de dénombrer les personnes en situation d’itinérance ont généralement été intermittentes, mais il est raisonnable d’affirmer que l’itinérance au Canada a connu une croissance importante entre 1980 et 2000. Sur une base quotidienne à Toronto, il y avait environ 1,000 personnes par nuit séjournant dans les refuges d’urgence pour les personnes sans-abris en 1980. En 1990, ce chiffre avait doublé. Et dix ans plus tard, il y avait doublé encore pour s’élever à 4,000. Le chiffre de 4,000 par nuit, à Toronto, est demeuré relativement constant au cours des 15 dernières années, même s’il a légèrement augmenté à la suite de la récession de 2008-2009, un phénomène sur lequel j’ai déjà écrit içi. (Certes, le nombre de personnes vivant dans des refuges d’urgence pour les personnes sans-abris sur une base quotidienne est un indicateur plutôt étroit de l’itinérance. Selon la Société canadienne d’hypothèques et de logement, environ 13% des ménages canadiens ont un « besoin impérieux en matière de logement; » pour le Nunavut, le chiffre est un énorme 39%.)

2. Bien qu’il soit difficile d’établir un lien de causalité, je pense que des hypothèses relativement sûres peuvent être faites sur certains des principaux contributeurs à l’itinérance. Les chercheurs sont généralement prudents sur l’utilisation du terme causalité—en fait, il y a des tensions de longue date entre les disciplines académiques sur quelles approches méthodologiques sont nécessaires pour l’établir. Les statisticiens, par exemple, croient généralement que des essais randomisés contrôlés (ERC) sont nécessaires pour établir un lien de causalité; mais comme David Freedman a fait valoir, les ERC sont souvent «impossibles ou contraires à l’éthique» (Freedman, 1999, p. 255). Les chercheurs prudents préfèrent plutôt s’exprimer par des phrases comme: « Ces facteurs ont probablement contribué à cet effet, » ou « Je pense qu’il est probable que ceci a causé cela. » C’est dans cet esprit que je voudrais suggérer qu’il y a probablement trois principaux facteurs qui ont contribué à l’itinérance au Canada: 1) les facteurs macroéconomiques (en particulier le chômage); 2) les changements à notre système de protection sociale (y compris une diminution de la disponibilité de logements sociaux, voulue par le gouvernement); et 3) la conception et l’administration des politiques dont le but spécifique est de répondre directement à l’itinérance (souvent désignés comme des «réponses» à des systèmes sans-abri).

3. L’itinérance a des ramifications profondes sur la vie des enfants. Comme j’ai écrit en 2012: «Deux études ont été faites à Toronto sur l’effet du logement sur les enfants qui ont dû être mis en charge de l’assistance publique.  Les résultats des deux études indiquent que, dans un cas sur cinq, l’ état du logement de la famille était un facteur dans l’admission temporaire dans l’assistance publique. Ces résultats de la recherche de Toronto indiquent également que, dans un cas sur 10, la situation du logement a retardé le retour à la maison de l’enfant» (Falvo, 2012, p. 14). Une autre recherche estime que, sur une base annuelle à Toronto seulement, environ 300 bébés sont nés de mères qui sont sans abri. (Bien sûr, l’itinérance peut avoir des conséquences profondes sur la vie des adultes aussi. Pour en savoir plus, voir cette étude de 2007).

4. Le rôle du gouvernement fédéral du Canada dans le financement et du logement pour les personnes à faible revenu et des programmes pour les personnes sans-abri a varié considérablement au fil du temps. Les provinces et les territoires consacrent beaucoup plus de leur propre argent au logement pour les personnes à faible revenu lorsque le gouvernement fédéral mène. Ainsi, un nombre considérable de logements sociaux pour les Canadiens à faible revenu ont été construits à partir du milieu des années 1960 jusqu’au début des années 1990. Depuis le début des années 1990, relativement peu de lodgements sociaux ont été construits au Canada. Je tiens également à noter que la valeur annuelle, ajustée à l’inflation, du financement fédéral pour les personnes sans-abri d’aujourd’hui vaut seulement 35% de ce qu’elle valait en 1999.

5. Chaque province / territoire ne répond pas à l’itinérance de la même manière. Alors que beaucoup plus de logements subventionnés pour les personnes à faible revenu se construisent lorsque le gouvernement fédéral mène, les provinces et les territoires ne répondent pas toujours aux initiatives fédérales de financement de la même façon. Par exemple, entre 2002 et 2013, trois fois plus de logements subventionnés ont été construits en Alberta (sur une base par habitant) qu’en Ontario. Je dirais qu’ une force majeure derrière cette différence provient de la bonne performance économique de l’Alberta au cours de cette même période par rapport à celle de l’Ontario.

6. Bien qu’un chercheur attentif soit prudent en discutant ce qui provoque l’itinérance, je pense que nous savons beaucoup de choses sur ce qui la résout. Dans de nombreux cas, une personne qui séjourne dans un refuge d’urgence pour les personnes sans-abris le quitte, sans importantes ressources publiques. Dans certains cas, elle pourrait trouver un logement sans beaucoup d’aide publique; dans d’autres cas, la famille et les amis peuvent lui fournir une assistance à court terme—par exemple, un soutien financier, un canapé pour dormir, etc. (Pour en savoir plus sur la durée de séjour dans des refuges d’urgence pour les personnes sans-abris dans un échantillon de villes canadiennes, voir cette étude écrite en 2013.) Les chercheurs et les défenseurs des sans-abri en général ne considèrent pas les séjours à court terme un grand défi pour la politique publique—le plus grand défi est dans le cas des personnes qui séjournent dans des refuges d’urgence pour les personnes sans-abris (et en dehors) pour des périodes de temps plus longues. Même ici, cependant, je dirais que ce qui constitue une réponse politique efficace de la part d’un gouvernement n’est pas un mystère.

En effet, dès le milieu des années 1980, les petits organismes sans but lucratif de l’Ontario (et peut-être dans d’autres provinces aussi) ont trouvé le succès dans la construction de logements subventionnés pour les personnes qui avaient vécu la vie de sans-abri à long terme—ils l’ont fait en offrant du soutien professionnel pour aider ces locataires à vivre de façon autonome dans ces unités. Cettte approche est connue sous le non de logements supervisés—à Salus (un organisme à but non lucratif à Ottawa) il est connu aujourd’hui sous le nom de logements avec soutien. L’émergence de logements supervisés en Ontario est due en grande partie à la forte sensibilisation due à des groupes communautaires. Cela comprenait: le Singles Displaced Persons Project; le mouvement consommateur / survivant; le slogan «homes not hostels; » la fondation de Houselink Community Homes; et la fondation de Homes First Society.  Les conditions d’éligibilité pour de tels logements varient d’un fournisseur à l’autre. Dans de nombreux cas, le locataire n’a pas à prouver sa préparation pour le logement avant de recevoir un logement. En fait, Homes First Society a obtenu son nom parce que ses fondateurs croyaient que, pour ces locataires, il était nécessaire d’avoir une résidence avant d’aborder d’autres défis (santé mentale, toxicomanie, emploi, etc.).

Aujourd’hui, chercheurs, praticiens et défenseurs appellent cette approche «logement d’abord». Et très récemment, un heureux ERC de «logement d’abord» a été mené dans cinq villes canadiennes. (J’ai déjà écrit à propos de cette étude ici.)

7. Il y a plusieurs façons de rendre les logements disponibles pour les ménages à faible revenu; toutes impliquent le secteur privé à des degrés divers. Parfois, lorsque le gouvernement subventionne des logements pour personnes à faible revenu, il fournit de l’argent à une entité à but non lucratif qui développe, possède et exploite des unités. D’autres fois, le gouvernement fournit une subvention aux propriétaires (soit à but lucratif ou à but non lucratif); en échange de la subvention, le propriétaire accepte de louer des logements à un taux réduit pour une période de temps déterminée (par exemple, dans certains cas, pour 10 ans). Et d’autres fois, le gouvernement fournit de l’argent (souvent connu comme une indemnité de logement ou allocation de logement) pour les locataires à faible revenu qui louent alors une unité d’un propriétaire à but lucratif. Parmi les trois approches possibles, j’ai une préférence pour l’option où une entité à but non lucratif développe, possède et exploite des unités (et je l’ai déjà écrit à ce sujet ici). Cela dit, je pense qu’il y a une place pour les trois approches, selon le contexte local.

8. Certaines juridictions, pour répondre á l’itinerance, ont utilisé des systèmes sophistiqués d’ information.  De nombreuses organisations au service des personnes sans-abri à Calgary recuellient des renseignements sur leurs clients dans une base de données appelée Homelessness Management Information System­—système également utilisé dans de nombreuses villes américaines. Des renseignements concernant le client (âge, état de santé, statut d’emploi et statut du logement) sont entrés dans la base de données quand un apport initial est effectué. Plus tard, alors que le client reçoit des services, des renseignements actualisés sont entrés de nouveau; dans le cas de certains programmes, des évaluations de suivi sont effectuées tous les trois mois. Dans le cas de certains types de programmes, il y a à la fois des évaluations de sortie et, après fermeture, des évaluations de suivi. Tous les renseignements en matière de vie privée sont soumis à la législation provinciale. Ces données, une fois recueillies, sont utilisées de façons diverses. Par exemple, certains organismes les utilisent pour fournir des services de gestion de cas pour les clients. En outre, les bailleurs de fonds sont en mesure d’évaluer la performance de chaque organisation par rapport aux repères (c-à-d, le pourcentage de clients qui reçoivent un logement après une période de temps spécifique).

9. En ce qui concerne la prévention et la réponse à l’itinérance, la capacité du gouvernement de générer des revenus revêt une grande importance. Les gouvernements utilisent généralement des revenus générés par l’impôt pour financer à la fois les logements sociaux et d’autres programmes sociaux importants. Lorsque les recettes fiscales diminuent, de nombreux gouvernements ont moins d’argent à consacrer à ces programmes. Depuis le milieu des années 1990, les recettes fiscales au Canada (mesurées en pourcentage de notre produit intérieur brut) ont diminué sensiblement. Si cette tendance ne se renverse pas bientôt, il sera très difficile pour de nombreux gouvernements (provinciaux, territoriaux et municipaux) d’investir dans des programmes sociaux importants.

Il y a actuellement un mouvement qui préconise l’augmentation des impôts; il est dirigé par Alex Himelfarb, ancien greffier du Conseil privé. Alex et son fils Jordan ont récemment co-édité un livre qui preconise une taxation plus élevée au Canada.

(Remarque: selon certaines écoles de pensée, ce n’est pas nécessaire pour un gouvernement souverain avec sa propre monnaie de taxer davantage afin de financer les dépenses sociale. Pour plus de renseignement sur cela, lire ici.)

10. Au cours de la prochaine décennie, le Canada verra probablement une augmentation substantielle de l’itinérance chez les aînés et chez les peuples autochtones (Premières Nations, Métis et Inuits). Les personnes aînées et les peuples autochtones sont de plus en plus nombreux comme un pourcentage de la population totale du Canada. En outre, le pourcentage de personnes âgées vivant sous la mesure de faible revenu de Statistique Canada a augmenté considérablement depuis le milieu des années 1990. Je pense que tout cela fait qu’il est probable que ces deux groupes vont commencer à croître en tant que pourcentage des populations sans-abri du Canada.

Les personnes suivantes m’ont aidé à préparer le présent blogue: Maroine Bendaoud, Lisa Burke, George Fallis, Greg Suttor, Francesco Falvo, Louise Gallagher, Ali Jadidzadeh, Lisa Ker, Jennifer Legate, Kevin McNichol, Richard Shillington, Blake Thomas et Mike Veall. Toutes les erreurs sont les miennes.

Ten Things to Know About Homelessness in Canada

$
0
0

This afternoon I gave a presentation at Raising the Roof’s Child & Family Homelessness Stakeholder Summit in Toronto. My slide deck can be downloaded here. To accompany the presentation, I’ve prepared the following list of “Ten Things to Know About Homelessness in Canada.”

1.Efforts to enumerate persons experiencing homeless have generally been spotty, but it is reasonable to assert that homelessness in Canada saw substantial growth in the 1980s and 1990s. On a nightly basis in Toronto, there were about 1,000 persons per night staying in emergency shelters in 1980. By 1990, that figure had doubled. And ten years later, there were 4,000 persons per night staying in Toronto’s emergency shelters. The Toronto figure of 4,000 per night has remained relatively constant for the past 15 years, though it has ‘edged up’ in the aftermath of the 2008-2009 recession—a phenomenon which I’ve previously written about here. (Admittedly, the number of persons living in emergency shelters on a nightly basis is a rather narrow gauge of homelessness. According to Canada Mortgage and Housing Corporation, approximately 13% of Canadian households are in “core housing need;” for Nunavut, the figure is a whopping 39%.)

2. Though it’s difficult to establish causation, I think relatively safe assumptions can be made about some of the major contributors to homelessness. Researchers are generally careful about using the term causation—in fact, there are long-standing tensions among academic disciplines as to what methodological approaches are required to establish it. Statisticians, for example, generally believe that randomized controlled trials (RCTs) are needed to establish causation; but as David Freedman has argued, RCTs are often “impractical or unethical” (Freedman, 1999, p. 255). Rather, careful researchers are more likely to say things like “these factors have likely contributed to this effect,” or “I think it’s likely that this effect caused this to happen.” And with that in mind, I’d like to suggest that there are probably three major factors that have contributed to homelessness in Canada: 1) macroeconomic factors (especially unemployment); 2) changes to our social welfare system (including a decrease in the availability of government-subsidized housing); and 3) the design and administration of policies whose specific intent is to respond directly to homelessness (often referred to as ‘systems responses’ to homelessness).

3. Homelessness has profound ramifications on the lives of children. As I wrote in 2012: “Two studies have been done in Toronto looking at the role of housing with respect to children in care. Results of both studies indicate that the state of the family’s housing was a factor in one in five cases in which a child was temporarily admitted into care. Results from the Toronto research also indicate that, in one in 10 cases, housing status delayed the return home of a child from care” (Falvo, 2012, p. 14). Other research estimates that, on an annual basis in Toronto alone, approximately 300 babies are born to mothers who are homeless. (Of course, homelessness can have profound ramifications on the lives of adults as well. For more on this, see this 2007 study.)

4. The role of Canada’s federal government in funding both housing for low-income persons and programming for homeless persons has varied considerably over time. Provinces and territories spend much more of their own money on housing for low-income persons when the federal government leads. Thus, a considerable amount of subsidized housing for low-income Canadians was built from the mid-1960s through to the early 1990s. Since the early 1990s, comparatively little subsidized housing has been built for low-income persons in Canada. I should also note that the annual, inflation-adjusted value of federal funding for homelessness today is worth just 35% of what it was worth in 1999.

5. Not every province/territory responds to homelessness in the same way. While much mores subsidized housing for low-income persons gets built when the federal government leads, provinces and territories don’t always respond to federal funding initiatives in the same way. For example, between 2002 and 2013, three times as many subsidized housing units were built in Alberta (on a per capita basis) than in Ontario. I would argue that a driving force behind this differential stems from Alberta’s strong economic performance during this same period relative to that of Ontario’s.

6. Though a careful researcher will be cautious in discussing what causes homelessness, I think we know a lot about what solves it. In many cases, a person who stays in an emergency shelter will ‘exit homelessness’ without substantial public resources. In some cases, they might find housing on their own; in other cases, family and friends may provide them with short term assistance—e.g. some financial support, a couch to sleep on, etc. (To learn more about lengths of stay in homeless shelters in a sample of Canadian cities, see this 2013 study.) Researchers and advocates for the homeless generally don’t view such short-term stays as a major public policy challenge—the bigger challenge is in the case of persons who stay in emergency shelters (and outside) for longer periods of time. Even here though, I would argue that it’s hardly a mystery as to what constitutes an effective policy response.

Indeed, as early as the mid-1980s, small non-profit organizations in Ontario (and possibly in other provinces as well) found success in building subsidized housing for persons who had experienced long-term homelessness—they did so by providing professional staff support to help such tenants live independently in those units. This was (and still is) known as supportive housing. The emergence of supportive housing in Ontario happened in large part due to strong advocacy by community-based groups. This included: the Singles Displaced Persons Project; the consumer/survivor movement; the slogan “homes not hostels;” the founding of Houselink Community Homes; and the founding of Homes First Society. Conditions of eligibility for such housing varied from one provider to the next. In many cases, the tenant did not have to prove ‘housing readiness’ before being offered a unit. In fact, Homes First Society got its name because its founders believed that its tenants needed homes first before addressing other challenges (i.e. mental health, substance use, employment, etc.).

Today, researchers, practitioners and advocates refer to this approach as ‘housing first.’ And very recently, a successful RCT of ‘housing first’ was conducted in five Canadian cities; I’ve previously written about that study here.

7. There are several ways of making housing available to low-income households; all of them involve the private sector to varying degrees. Sometimes when government subsidizes housing for low-income persons, it provides money to a non-profit entity that develops, owns and operates the units. Other times, government provides a subsidy to landlords (either for-profit or non-profit); in exchange for the subsidy, the landlord agree to rent units at a reduced rate for a specified period of time (e.g. in some cases, for 10 years). And other times, government provides money (often known as a housing allowance) to low-income tenants who then rent a unit from a for-profit landlord. Of the three possible approaches, I personally have a preference for the option where a non-profit entity develops, owns and operates the units (and I have previously written about this here). Having said that, I think there’s a place for all three approaches, depending on local context.

8. Some jurisdictions have used sophisticated information management systems as part of their efforts to respond to homelessness. Many organizations serving homeless persons in Calgary enter client information into a database called the Homelessness Management Information System, a system that is also used in many American cities. Client-level information (such as age, health status, employment status and housing status) is entered into the database when an initial intake is done. While the client is receiving services, updated information is entered again; in the case of some programs, follow-up assessments are done every three months. In the case of some program types, there are both exit and post-exit follow-up assessments completed. All information-gathering is subject to provincial privacy legislation. There are many uses for the data once it’s gathered. For example, some organizations use the data to provide case management services to clients. Also, funders are able to assess each organization’s performance against benchmarks (i.e. percentage of clients who receive housing after a specific period of time).

9. When it comes to both preventing and responding to homelessness, the capacity of government to generate revenue matters a great deal. Governments typically use revenue generated from taxation to finance both subsidized housing and other important social programs. When tax revenue decreases, many governments have less ability to spend on such programs. Since the mid-1990s, tax revenue in Canada (measured as a percentage of our Gross Domestic Product) has decreased substantially. If this trend doesn’t reverse itself soon, it will be very challenging for many governments (especially provincial, territorial and municipal governments) to invest in important social programs. There is currently a move afoot by some Canadians to increase taxes; it is led by Alex Himelfarb, former Clerk of the Privy Council. Alex and his son Jordan recently co-edited a book that calls for the need for higher taxation in Canada. (Note: according to some schools of thought, it isn’t necessary for a sovereign government with its own currency to tax more in order to finance more social spending. While keeping in mind that such an approach would be most relevant to Canada’s federal government—and much less relevant to provincial, territorial and municipal governments—readers can read more about one such school of thought here.)

10. Over the course of the next decade, Canada will likely see substantial increases in homelessness among both seniors and Indigenous peoples (First Nation, Métis and Inuit). Seniors and Indigenous peoples are growing as a percentage of Canada’s total population. Further, the percentage of seniors living below Statistics Canada’s Low-Income Measure has grown substantially since the mid-1990s. I think all of this makes it likely that both of these groups will begin to grow as a percentage of Canada’s homeless populations.

The following individuals were very helpful in helping me prepare the present blog post: Maroine Bendaoud, Lisa Burke, George Fallis, Greg Suttor, Francesco Falvo, Louise Gallagher, Ali Jadidzadeh, Lisa Ker, Jennifer Legate, Kevin McNichol, Richard Shillington, Blake Thomas and Mike Veall. Any errors are mine.


February Labour Force Woes

$
0
0

The unemployment rate is up again this month, to 7.3%, with 1.4 million workers looking for jobs in February. A loss of full-time work was partly replaced by part time positions. A disproportionate percentage of last year’s growth came from precarious self-employment.

Remember those heady days when we could say that at least Canada’s unemployment rate was lower than the U.S.? Yeah. Adjusted to U.S. concepts the Canadian unemployment rate is 6.2%, compared to their 4.9%.

Well, all is not lost. The Alternative Federal Budget was released yesterday, and it included some pretty key investments to create jobs, boost economic growth, lower income inequality, and lift people out of poverty.

While there are many great suggestions in the AFB (fully costed, with a distribution impact assessment), the job numbers today show that improvements to Employment Insurance are particularly urgent. And with EI, skills training and supports to help workers adjusting to shifts in the economy.

Saskatchewan, my home province, lost 7,800 jobs in February, and 6,000 more workers left the labour market. Alberta has lost more than 50,000 full time jobs over the past year. Having lost high wage jobs in the natural resource industry, many are wondering what comes next.

This is why the labour movement talks about a just transition. Individual workers shouldn’t have to bear the brunt of economic restructuring on their own. A strong social safety net, skills training programs, and thoughtful social and physical infrastructure investment can cushion the blow for workers now, and speed the transition to a more prosperous future.

Go read the AFB, it’s time to move on.

Equal Pay Day

$
0
0

Every year, women around the world celebrate (angrily) the day their average full-time full-year earnings have caught up to men’s average full-time full-year earnings from the year before.

This year in the United States that day fell on April 12th. In Germany it was March 19th. In Switzerland it was February 24th.

In Ontario? Equal Pay Day** comes on April 19th.

This will be the third year that the Ontario provincial government officially recognizes Equal Pay Day, but this year there is cause to be hopeful that change is in the works. Not only has the Ontario provincial government been examining this issue, but the federal government has convened a special committee on pay equity.

To help us better understand gender pay gap dynamics in Ontario, Dr. Kendra Coulter at Brock University conducted a survey of retail workers, an already low wage and feminized sector. Sheetal Rawal, a lawyer and pay equity expert, contributed analysis and context, and I helped out with some numbers. Our whole report can be found on Dr. Coulter’s website, revolutionizingretail.org.

What we found will sound familiar to many who have worked on pay equity issues over the years. Managers are more likely to be men, lower wage occupations within retail are more likely to be women. Men are more likely to be employed full time, whether they are managers or cashiers. Even within retail locations, managers have gendered ideas about skills, expecting women to be better with customers or to be good at cleaning tasks, and expecting men to do more physical labour.

Equal Pay Day is calculated based on the difference in full-time earnings between men and women, but it turns out it is not just about wage equity, but also about “hours equity”.

The women who responded to Dr. Coulter’s survey wanted more hours, but were consistently frustrated with growing precarious work trends in their workplaces. They told us that unpredictable scheduling is the norm rather than the exception, and it is common for employers to hire more casual workers instead of giving current workers more hours. This persistent hours deficit combined with unpredictability takes a toll on workers, especially if they have unpaid work responsibilities as well.

As our report notes, “Workers are often expected to have full-time availability without any of the benefits (financial and otherwise) that come with being employed fulltime.”

Our report makes several recommendations about how the Employment Standards Act can address the gender gap in hours, including:

  • advance notice for work schedules,
  • minimum hours guarantees,
  • requiring that part-time, contract, and temporary workers be paid the same wage as full-time workers doing the same tasks, and
  • paid sick leave.

Provincial consultations on the gender pay gap ended on February 29th, 2016, and a report is expected from the steering committee in May 2016. Then we’ll need to mobilize to make sure the evidence gathered results in concrete changes for women in Ontario, and across Canada. Otherwise, we’ll be waiting another 228 years for the wage gap to close on its own.

Ain’t nobody got time for that.

**Your own personal Equal Pay Day may vary significantly, based on a variety of factors. The Labour Force Survey gives us some insight into the pay gap for new Canadians and Aboriginal workers living off reserve.  The CCPA in Ontario have calculated that women who are landed immigrants earn $21,000 less per year than non-immigrant men (39% pay gap), and Aboriginal women earn $31,000 less per year than non-Aboriginal men (57% pay gap). We desperately need better data on the pay gap for racialized workers and workers living with disabilities.

Federal Income Support for Low-Income Seniors

$
0
0

Over at the Behind the Numbers web site, Allan Moscovitch, David Macdonald and I have a blog post titled “Ten Things to Know About Federal Income Support for Low-Income Seniors in Canada.”

The blog post argues—among other things—that if the age of eligibility for Old Age Security were to move from 65 to 67, the percentage of Canadians aged 65 and 66 living in poverty would see a very substantial rise.

The post is based on a recent chapter we’ve written for How Ottawa Spends, an annual publication of Carleton University’s School of Public Policy and Administration.  In the chapter, we estimate the rise in poverty with the help of Statistics Canada’s Social Policy Simulation Database and Model.

The link to the blog post can be found here.

Guaranteed Annual Income

$
0
0

Over at the web site of the Calgary Homeless Foundation, I’ve written a blog post titled “Ten things to know about Canada’s guaranteed annual income debate.”

Points raised in the blog post include the following:

-There are people and groups on both the left and right of the political spectrum who favour a Guaranteed Annual Income (also known as a “basic income”).

-One reason for support on both the left and right is that there is considerable discrepancy in terms of how generous the benefit should be.  This also makes it challenging to estimate its annual cost.

-It’s not clear what the desired outcome(s) of such a scheme would be.  This too may depend on which advocates/proponents you talk to.

-The implementation of a Guaranteed Annual Income would require a considerable amount of intergovernmental cooperation.

The link to the full blog post is here.

Ten things to know about the CPP debate

$
0
0

This fall, Canada’s Parliament will debate a proposal to expand the Canada Pension Plan (CPP).  And over at the Behind the Numbers web site, I’m co-author of a blog post titled “Ten things to know about the CPP debate.” The blog post’s other co-authors are Allan Moscovitch and Richard Lochead.

Points raised in the blog post include the following:

-CPP covers a smaller percentage of a retired person’s income than similar schemes in most OECD countries.

-CPP helps reduce poverty in Canada, but it doesn’t provide any of its beneficiaries with sufficient retirement income.

-CPP’s former Chief Actuary has proposed an expanded CPP scheme that would almost eliminate the need for private pension schemes in Canada.  This proposal has been virtually ignored by most of Canada’s elected officials and journalists.

The link to our full blog post is here.

The Federal Role in Poverty Reduction

$
0
0

Over at the web site of the Calgary Homeless Foundation, I’m co-author of a blog post titled “The Federal Role in Poverty Reduction.”

Points raised in the blog post include the following:

-Canada’s Minister of Families, Children and Social Development has been tasked to lead the development of a Canada Poverty Reduction Strategy.

-Total public social spending in Canada (as a % of GDP) is well below the OECD average.

-Our current federal government has already taken several important initiatives pertaining to poverty reduction.

-Measures our current federal government could take to further reduce poverty in Canada include bringing in a national early learning and child care framework/strategy, expanding the Working Income Tax Benefit, implementing universal pharmacare and providing more funding for affordable housing.

-Macroeconomic policies that could assist with these endeavours include deficit financing, increasing personal income taxes for high-income earners, increasing corporate income taxes, and addressing inequities in our tax-expenditure system.

-Any poverty reduction strategy should be undertaken in partnership with First Nations, Inuit and Métis peoples.

The link to the full blog post is here.

The Alternative Federal Budget 2017

$
0
0

This year’s Alternative Federal Budget (AFB) was released on March 9. I was proud to be the primary author of its housing chapter (that chapter is available in English here and in French here).

The first AFB exercise began in 1994, with the first AFB being published in 1995. That involved a joint effort between the Canadian Centre for Policy Alternatives (CCPA) and CHO!CES: A Coalition for Social Justice.

Here are 10 things to know:

  1. Job creation has always been a major focus of the AFB. People need employment to earn income and live fulfilling lives. New jobs also creates important goods and services that help the rest of us prosper. And the more people are working, the more taxes they pay, and the less we (as a collective) have to spend on poverty reduction initiatives (such as social assistance). The type of jobs that get created matter too, as do working conditions; indeed, it’s important that people be happy in the workplace. Finally, who gets jobs matters —think gender, think racial diversity, think Indigenous peoples, think persons with disabilities.
  1. The AFB has always proposed a redistribution of income. This year’s document, for example, proposes a transfer of income (through our tax and transfer system) from households in the top six income deciles to those in the bottom four deciles; households in the top decile would the largest ‘loss,’ and households in the bottom decile would receive the lion’s share of the transfer. The AFB proposes to do this in part by closing tax loopholes for companies and high-income individuals. It also proposes to make our income tax system more progressive and to spend more on important social programs. This proposed transfer of income is illustrated in the figure below (which I’ve ‘cut and paste’ from the Macroeconomic Policy chapter of this year’s document).


  1. Gender equality has always been one of the AFB’s major priorities. According to Paul Leduc Browne, the project has always “stressed policies to both recognize the importance of unwaged labour (domestic and volunteer work) and to increase the participation of women in wage labour. These included investment in child care, but also changes to the unemployment insurance, social assistance, family allowance, and pension programs” (Leduc Browne, 2003, p. 40). The following bar graph from this year’s AFB illustrates the estimated, direct financial impact of this year’s AFB on gender (this too has been ‘copied and pasted’ from the document’s Macroeconomic Policy chapter).


  1. In the mid-1990s, the project had a strong focus on monetary policy.[1] At that time, the Bank of Canada had raised interest rates to the point where holders of financial wealth did well (because they got good rates of return on their savings). But these high interest rates also made it expensive for both businesses and governments to borrow money to create new jobs; it also made it expensive for all orders of government to service public debt they’d already incurred. All of this resulted in slow economic growth, high unemployment and immense pressure on social programs. (For more on this, see this 1993 report co-authored by the late Mike McCracken.)
  1. The AFB has always had an impact on public policy, even in the early years. Every year, for example, AFB working group members have briefed members of the Liberal and New Democratic Party (NDP) caucuses at the federal level.[2] According to Paul Leduc Browne: “[I]n the earlier years, the finance minister himself always read our budget; until 1999, we had a meeting with him each year after the publication of our alternative budget” (Leduc Browne, 2003, pp. 41-42). More recently, it’s abundantly clear that the Trudeau Liberals’ 2015 campaign platform was strongly influenced by the previous year’s AFB. In fact, staff at the CCPA estimate that 30% of the previous year’s AFB found its way into the Trudeau Liberal platform.
  1. The forecasting done for the AFB has proven more accurate than that done by the federal government. As Bruce Campbell notes: “The AFB gained credibility within policy circles and the media not only for its sophisticated fiscal framework, but also for its accurate predictions of emerging budgetary surpluses between 1999 and 2004. Year after year our forecasts were much more accurate than those released by the Department of Finance, which tried to hide the surplus—money that could have been put back into social programs…” (Campbell, 2015, p. 26). This helped spur the creation of the Parliamentary Budget Officer, which the AFB had recommended.
  1. This exercise brings together like-mind people across the country and across sectors. As Paul Leduc Browne writes: “The project has brought together a wide range of groups and individual citizens from many sectors of civil society: labour, students, women, churches, anti-poverty groups, Aboriginal organizations, child care, health care, education, housing, farm coalitions, environmental organizations, international development NGOs, and other social and economic justice groups” (Leduc Browne, 2003, p. 37). Bringing together people and groups also means encouraging healthy debate and tensions. “The important point is that such tensions are healthy; I feel we were fortunate to experience them” (Leduc Browne, 2003, p. 41).
  2. This exercise has done an excellent job of embracing bilingualism and partnering with Quebec-based contributors. The full document has always been published in both English and French (the 187-page French version is available here). Given the length of the document, that shows a very strong commitment to empowering French-speaking audiences and bridging what has sometimes been referred to as Canada’s “two solitudes.” What’s more, Quebec-based unions and civil society groups have participated in the project.
  1. There have now been alternative budgets in five Canadian provinces. Those provinces are British Columbia, Saskatchewan, Manitoba, Ontario and Nova Scotia. Most of these efforts have been coordinated by the CCPA. There have also been municipal alternative budgets, including in Halifax and Winnipeg.
  1. Soon, Alberta will have its first alternative budget. As I’ve discussed elsewhere, a group of volunteers recently took an initial step toward an alternative budget for Alberta. Building on a series of discussions with individuals in the province’s nonprofit sector, labour movement and advocacy sector, we produced a document seeking to provide a foundation for moving toward an alternative budget. We hope this becomes an annual exercise in Alberta, and we hope the project’s scope increases each year.

The author wishes to thank Bruce Campbell, David Macdonald, Gayle Rees, Erika Shaker, John Smithin and Armine Yalnizyan for invaluable assistance with this blog post. Any errors are his.

[1] Admittedly, monetary policy is not, strictly speaking, a budget issue (Bruce Campbell notes this here). However, budgets (and alternative budgets) provide an opportunity to discuss the main contributors to unemployment.

[2] I’m told that, while in opposition, members of the Liberal caucus paid more attention to the AFB than did members of the NDP caucus.


The introduction and evolution of child benefits in Canada

$
0
0

Allan Moscovitch and I have co-authored a blog post that looks at the history of child benefits in Canada.

Points made in the blog post include the following:

-Child benefits can reduce both poverty and homelessness.

-When child benefits began in Canada after World War II, one major motivating factor for the federal government was to avoid recession. Another was to fend off social unrest (i.e. Canada’s growing labour movement and the growing popularity of the CCF).

The full blog post can be read here.

Fiscal situation of Canada’s ‘oil rich’ provinces

$
0
0

I’ve just written a blog post about the fiscal situation of Canada’s ‘oil rich’ provinces (i.e., Alberta, Saskatchewan and Newfoundland and Labrador). It consists of a summary of key points raised at a PEF-sponsored panel at this year’s Annual Conference of the Canadian Economics Association.

Points raised in the blog post include the following:

-The price of oil is impossible to accurately predict, and there’s no guarantee it will rise to past levels.

-Each of Canada’s ‘oil rich’ provinces should therefore find other ways of financing future spending.

The full blog post can be found here.

Canada Lags in Job Quality

$
0
0

The 2017 OECD Employment Outlook provides an assessment of member country performance in terms of the quantity and quality of employment as judged by a new set of key indicators.

Overall, we do well in terms of job quantity. The employment rate (the proportion of the working age population with jobs) stands at 72.5% compared to an OECD average of 66.4%. However, the Scandinavian countries rank higher for this indicator (eg Sweden, 75.5%.)

It is interesting to note that the employment rate in the United States is, at 68.7%, just a bit above the OECD average. Poor job quality does not provide an obvious boost to jobs.

The gap between the employment rate of prime age men and disadvantaged groups (each of youth, older workers, young mothers, persons with disabilities) is slightly below average in Canada, but well below leading countries.

The annual gender earnings gap in Canada is slightly worse than the OECD average of 39.0% – women earn 39.7% less here than do men, compared to a gap of 24.4% in Sweden. And unlike most other countries, progress in closing the gender gap has stalled.

Where we fare especially badly is in terms of low income. The low income rate for the working age population (percentage with incomes below one half of median annual income) is 12.8% in Canada compared to an average of 10.6% for the OECD, and just 9.4% in Sweden and 6.7% in Denmark.

Canada could and should be doing much better.

http://www.oecd.org/els/oecd-employment-outlook-19991266.htm

Ten Things to Know About Social Assistance in Alberta

$
0
0

I’ve just written a blog post about social assistance in Alberta.

Points raised in the post include the following:

-It’s very difficult to quality for social assistance in Alberta (this is also the case in all other provinces and territories). Reasons why are discussed in this previous blog post of mine.

-In the 1990s, there were changes to the rules governing social assistance in Alberta. From that point on, it became even harder to qualify for social assistance in Alberta.

-In Alberta, persons experiencing homelessness are not eligible to receive some forms of social assistance.

The full blog post can be accessed here

Self-insurance for workers doesn’t work

$
0
0

This is a guest post from Rod Hill, a Professor of Economics at the University of New Brunswick, Saint John campus. A previous version of this post first appeared in the New Brunswick Telegraph Journal.

In a report this month for the Halifax-based Atlantic Institute for Market Studies (AIMS), entitled “An Alternative to Employment Insurance”, Justin Hatherly proposes replacing the Employment Insurance (EI) system. A look at the proposal quickly reveals how unsatisfactory it is.

Instead of EI, Mr. Hatherly wants individuals and employers to contribute to Personal Security Accounts (PSAs). These accounts would be the property of the individuals, which they could draw upon in certain circumstances in the event of unemployment. The funds would be invested in the stock market by an independent board.

In effect, he is proposing to eliminate EI while expanding the current Registered Retirement Savings Plan (RRSP) system with some compulsory contributions, while restricting the withdrawal of those additional funds.

He writes “Persons who lose work through no fault of their own can draw 55 percent of their wages [up to the insured maximum] for 24 weeks, provided they had contributed for 960 hours” (about 24 weeks of full-time work). “Those who left their prior employment voluntarily would be ineligible” – but why deny them access to their own savings? Quitting a job get a better one is something to be encouraged.

Crucially, “those with insufficient savings receive benefits from a common fund financed by general revenue. However, they incur a negative balance and must pay back the government before contributing to their PSA” to be eligible for further withdrawals or loans.

AIMS is proposing that individuals should rely entirely on their own savings or borrowed money to survive during a period of unemployment.

Every insurance system, public or private, has the feature that those who experience a bad outcome (a house fire, a car accident, a health crisis, layoff, and so on) have benefits that are paid by those who have not (yet) experienced a bad outcome. That is the whole point of insurance. Risk for everyone is reduced as risk is pooled across the whole population.

Instead, Mr. Hatherly is inviting people to ‘self insure’ like people do if they fail to buy house insurance. We all know how that turns out if your house burns down.

A few lengthy periods of unemployment would be no more pleasant. When people self-insure, they bear the entire risk themselves. Those with high and steady incomes may be able to shoulder that risk, but most people, particularly those with lower incomes, would not.

I did a calculation to see how this system would work. Someone earning $50,000 a year and making contributions of 4 percent could take 6 years to accumulate enough resources to cover the proposed maximum withdrawal from their Personal Security Accounts. (Under the current EI system, such a person would be guaranteed a minimum of 36 weeks of benefits, not the 24 in the AIMS scheme.)

This assumes that the invested funds would grow steadily. When the last recession began in 2008-2009, the national unemployment rate rose from 6.1 percent to 8.3 percent, while the Toronto Stock market index fell by more than 40 percent. If unemployed workers had been relying on Personal Security Accounts, their funds would have been decimated at the time they needed them the most.

In his report, Mr. Hatherly notes that even unemployment might not diminish the Personal Security Accounts very much because of “restrictive conditions on benefit withdrawal and duration” – a point which underscores the inadequacy of his proposal for maintaining income and spending after job loss.

An important feature of EI is that benefits and the spending they support kick in quickly where and when layoffs occur. This helps shorten recessions by maintaining total spending.

Mr. Hatherly is right about one thing. With workers left to support themselves during periods of unemployment, they will have an incentive to find employment quickly – assuming, as he seems to, that jobs are available. (Particularly in recessions, the number of people looking for work far exceeds the number of job openings.)

However it’s better for both workers and employers if people to take time to find a job well suited to their skills. As well, a lack of income support during unemployment would increase the bargaining power of employers and push down wages.

No one would argue that the existing EI system is perfect. A much criticized feature is its division of the country into regions where eligibility criteria and benefit duration vary greatly.

In those with the lowest unemployment rates, typically urban areas, a minimum of 700 hours of work are required to be eligible for only 14 weeks of benefits. A minimum of 1820 hours (about 46 weeks of full-time work) are needed for 36 weeks of benefits.
In regions with the highest unemployment rates, 420 hours of work gives eligibility for 32 weeks of benefits. The result is a permanent subsidy to regions of high unemployment and inadequate access to EI benefits for many in urban areas. Just because the unemployment rate is low does not mean that it is easy to get a job. Many people are increasingly stuck in ‘precarious work’, temporary or part-time with no job security.

Any change to this system towards one with greater national uniformity would have to be done gradually to avoid undue hardship in high unemployment regions. It would be best done in conjunction with other changes to income supports, such as guaranteed minimum incomes, an idea governments are now seriously considering.

However, but AIMS’ radical proposal to scrap Employment Insurance completely and to leave individual workers on their own to bear all the risk of unemployment is not an improvement.

Panel discussion at federal NDP policy convention

$
0
0

Yesterday I spoke on a panel discussion on economic inequality, along with Andrew Jackson and Armine Yalnizyan. We were guests at the federal NDP’s policy convention in Ottawa. The panel was moderated by Guy Caron.

Topics covered included the minimum wage, basic income, affordable housing, the future of jobs, gender budgeting, poverty among seniors, Canadian fiscal policy in historical perspective, and Canadian fiscal policy in comparison with other OECD countries.

The discussion was 30 minutes long. You can watch it here.

Ten proposals from the 2018 Alternative Federal Budget

$
0
0

I’ve written a blog post about this year’s Alternative Federal Budget (AFB).

Points raised in the blog post include the following:

-This year’s AFB would create 470,000 (full-time equivalent) jobs in its first year alone. By year 2 of the plan, 600,000 new (full-time equivalent) jobs will exist.

-This year’s AFB will also bring in universal pharmacare, address involuntary part-time employment among women, eliminate tuition fees for all post-secondary students in Canada, speed up implementation of the federal carbon tax, and increase the corporate tax rate from 15% to 21%.

-I’m particularly intrigued by the AFB’s poverty reduction measures, which include a sizeable top-up to the GST rebate, a $4 billion annual transfer to the provinces and territories, increases to seniors’ benefits, and $3.5B in new spending for housing.

The full blog post can be found here.


Five Things to Know About the 2018 Federal Budget

$
0
0

I’ve written a blog post about the 2018 federal budget.

Points made in the blog post include the following:

-Important new housing investments were made for First Nations, Inuit and Métis people.

-The Working Income Tax Benefit was expanded, made automatic and rebranded (i.e., renamed).

-Canada’s official unemployment is now the lowest it’s been in decades.

-Canada’s federal debt-to-GDP ratio is (by far) the lowest of any G7 country.

The link to the full blog post is here.

Homelessness and employment: The case of Calgary

$
0
0

I’ve just written a blog post about homelessness and employment, with a focus on Calgary (where I live and work).

Points raised in the blog post include the following:

-Persons experiencing homelessness usually have poor health outcomes, making it especially challenging to find and sustain employment.

-There are several non-profits in Calgary that assist persons experiencing homelessness to find and sustain work.

-Persons finding the most success in those programs tend to be relatively healthy (compared with their peers) and be between the ages of 25 and 60.

-In some cases, persons experiencing homelessness are overqualified for jobs.

-There is some evidence that subsidized housing can improve employment outcomes.

The link to the full blog post is here.

Ten proposals from the 2018 Alberta Alternative Budget

$
0
0

The 2018 Alberta Alternative Budget (AAB) was released yesterday—it can be downloaded here. An opinion piece I wrote about the AAB appeared yesterday in both the Calgary Herald and the Edmonton Journal.

Inspired by the Alternative Federal Budget exercise, this year’s AAB was drafted by a working group consisting of individuals from the non-profit sector, labour movement and advocacy sectors.

Here are 10 proposals from this year’s AAB.

  1. Introduce a 5% provincial sales tax. The AAB gives the Notley government credit for generating additional revenue by increasing both personal and corporate tax rates, while also increasing tobacco and fuel taxes. However, in light of the very substantial loss in revenue as a result in the drop of the price of oil, we’d like to see the Alberta government take one step further and introduce a provincial sales tax. A 5% provincial portion, added on to the 5% Goods and Services Tax, could result in a 10% Harmonized Sales Tax (HST). This would generate approximately $5 billion annually.


  1. Introduce an HST rebate for low-income households. It’s well-known that sales taxes in general have a larger impact on low-income households than on higher income households (that’s because lower-income households spend a larger proportion of their income on consumption). To counteract that, the AAB proposes the introduction of an HST rebate for low-income households.


  1. Introduce provincial pharmacare. Many low-income Albertans currently struggle to afford prescription medication; and many employers (especially small businesses) struggle to afford health and dental programs for their employees. Not only would a universal coverage prescription drug plan ensure prescription drug coverage for all; it would take advantage of bulk purchasing, reducing costs for both households and employers.


  1. Increase staffing in long-term care facilities. This year’s AAB would hire more registered nurses and health care aids for Alberta’s long-term care facilities. We would spend enough to bring facilities up to the minimum recommended staffing levels. This would result in improved quality of care.


  1. Reduce class sizes in K-12 education. Specifically, the AAB proposes to bring class sizes at the K – 3 level down to levels recommended by the Alberta Commission on Learning. We’d do this by hiring more teachers, education assistants and support staff.


  1. Reduce tuition fees for all post-secondary students in the province. While we believe the complete elimination of tuition fees is a laudable long-term goal, for this coming budget year, the AAB proposes to reduce tuition fees for all post-secondary students in Alberta by 20%. The AAB would also eliminate the interest on the provincial portion of student loans, as well as invest in grants to current students.


  1. On the Indigenous file, create an Intergovernmental Relations position in each provincial ministry. The AAB would invest in cultural capacity-building in all 22 provincial ministries. One Intergovernmental Relations position would be created in each ministry; that role would focus on relations between the ministry and Indigenous peoples, keeping in mind challenges when working across ministries and departments at all orders of government.


  1. Implement universal child care. The AAB would expand the Notley government’s current pilot program of $25-per-day child care, making subsidized and regulated child care to all Alberta households. Among other things, we expect this to result in increased labour market participation by women.


  1. Increase social assistance benefit levels. Social assistance (i.e., ‘welfare’) recipients have seen the monthly value of their benefits decrease in real terms over the past several years. Today, a single adult (without dependents) on social assistance in Alberta receives just $8,000 annually to live on.[1] The AAB would increase monthly benefit levels by $150 and index these benefits to inflation going forward.


  1. Create more affordable housing. The AAB would fund the repair of existing social housing units; it would also provide funding to build new affordable housing for vulnerable populations (e.g., persons experiencing absolute homelessness, the frail elderly, persons with HIV/AIDS). Further, it would provide funding for rent supplements (i.e., financial assistance for rent) to low-income households.


In Sum. Budgets are always about choices, and that principle has guided alternative budget exercises across Canada for over two decades. This year’s AAB proposes a costed-out set of policy proposals that would improve labour market, health and education outcomes, while also addressing principles of reconciliation and reducing income inequality.


[1] A person with a severe disability can receive more.

Saskatchewan budget misses opportunity on rental housing assistance

$
0
0

I recently wrote a ‘top 10’ overview blog post about the 2018 Saskatchewan budget. Following on the heels of that, I’ve now written an opinion piece about the budget’s announcement of a phase out a rental assistance program for low-income households.

Points raised in the opinion piece include the following:

-Across Saskatchewan, rental vacancy rates are unusually high right now, making this a good time to provide rental assistance to tenants for use in private units (indeed, right now it’s a so-called renter’s market in Saskatchewan, meaning it’s a relatively good time for tenants to negotiate rental agreements with private landlords).

-Thus, rather than phasing out the program, it would have been sensible to have expanded it.

-Phasing it out will very possibly lead to more homelessness, which in turn may lead lead to higher public costs elsewhere (especially to the health care sector).

Interestingly, just yesterday the Saskatchewan Landlord Association made many of these same points themselves; they like the rental assistance program, as it increases demand for its members’ housing units (many of which are currently sitting empty).

It’s of course also important for government to finance housing owned by non-profit entities. I recently wrote about the importance of a variety of measures to improve housing affordability in the housing chapter of this year’s Alternative Federal Budget.

Meanwhile, the link to my recent opinion piece is here.


Call for federal support of cancelled Ontario basic income project

$
0
0

Members of the Progressive Economists Forum noted with dismay the premature cancellation of Ontario’s basic income pilot and have penned an open letter to Federal Minister Jean-Yves Duclos (Families, Children and Social Development) calling for federal support for the project. So far, the letter has been signed by 50 Canadian economists and researchers.

_____

Dear Minister Duclos:

As economists and researchers, we noted with dismay the premature cancellation of Ontario’s Basic Income Pilot. The announced cancellation before the first anniversary of full enrollment ensures that no useful data can have been collected to date, and none will now be collected. This deprives not only Ontario but also the rest of Canada of valuable evidence that might have influenced policy. Ontario was one of several Basic Income experiments worldwide that, together, would have allowed international comparisons and rational policy development.

We, the undersigned economists and researchers, are writing to ask you to use the resources and authority of your office to salvage what you can of the Ontario Basic Income Pilot for the benefit of all Canadians and, especially, to ensure that the 4,000 vulnerable participants who agreed in good faith to participate in Ontario’s experiment are treated in a just and humane manner.

Closing the experiment with no announcement of how participants will be transitioned out of the program is unethical. Participants used the money they received from participation in the experiment and relied upon the promises that were made by the Ontario government to make long-term plans to better their lives. They leased apartments, registered in postsecondary education and borrowed money to invest in the future wellbeing of their families. As a result of the cancellation, they are likely to be worse off now than before they agreed to open their lives to researchers. This is unconscionable and must not be allowed to happen.

Thank you for your consideration.

Sincerely,

1. Abdella Abdou, Associate Professor, Department of Economics, Brandon University

2. Roy J. Adams, Professor Emeritus, DeGroote School of Business, McMaster University and Ariel Sallows Chair of Human Rights, Emeritus, College of Law, University of Saskatchewan

3. John Allett, Professor Emeritus, Department of Social Science, York University

4. Sheila Block, Senior Economist, Canadian Centre for Policy Alternatives – Ontario

5. Jordan Brennan, Economist, Unifor

6. Jerry Buckland, Professor, Menno Simons College, University of Manitoba

7. Mary Anne Coffey, Contract Faculty, Department of Social Science, York University

8. Anupam Das, Associate Professor, Economics, Department of Economics, Justice, and Policy Studies, Mount Royal University

9. Megan J. Davis, Associate Professor, Department of Social Science, York University

10. Robert W. Dimand, Professor, Department of Economics, Brock University

11. Susan Dimock, Professor, Department of Philosophy, York University

12. Lynne Fernandez, Errol Black Chair in Labour Issues, Canadian Centre for Policy Alternatives – Manitoba

13. Ernest Epp, Professor Emeritus, Department of History, Lakehead University

14. Evelyn Forget, Professor, Department of Community Health Sciences, University of Manitoba and Academic Director of the Manitoba Research Data Centre

15. Marjorie Griffin Cohen, Professor Emerita, Department of Political Science and Department of Gender, Sexuality, and Women’s Studies, Simon Fraser University

16. Ricardo Grinspun, Associate Professor, Department of Economics, York University

17. Trevor Harrison, Professor, Department of Sociology, University of Lethbridge

18. Alex Hemingway, Economist and Public Finance Policy Analyst, Canadian Centre for Policy Alternatives – British Columbia

19. Trish Hennessy, Director, Canadian Centre for Policy Alternatives – Ontario

20. Rod Hill, Professor of Economics, Faculty of Business, University of New Brunswick, Saint John

21. Ian Hudson, Professor, Department of Economics, University of Manitoba

22. Iglika Ivanova, Chair, Progressive Economics Forum and Senior Economist, Canadian Centre for Policy Alternatives – British Columbia

23. Mustapha Ibn Boamah, Associate Professor of Economics, Faculty of Business, University of New Brunswick, Saint John

24. Thaddeus Hwong, Associate Professor, School of Public Policy and Administration, York University

25. Andrew Jackson, Adjunct Research Professor, Institute of Political Economy, Carleton University

26. Peggy Keall, Assistant Professor, Department of Social Science, York University

27. Kamala Kempadoo, Professor, Department of Social Science, York University

28. Gerda Kits, Associate Professor of Economics, The King’s University

29. Seth Klein, Director, Canadian Centre for Policy Alternatives – British Columbia

30. Tuulia Law, Sessional Assistant Professor, Department of Social Science, York University

31. Marc Lee, Senior Economist, Canadian Centre for Policy Alternatives – British Columbia

32. Martha MacDonald, Professor of Economics, Sobey School of Business, Saint Mary’s University

33. Hugh Mackenzie, Consulting Economist and Principal, Hugh Mackenzie & Associates

34. Fiona MacPhail, Professor and Chair, Department of Economics, University of Northern British Columbia

35. Joan McFarland, Professor, Department of Economics, St. Thomas University

36. Merouan Mekouar, Assistant Professor, Department of Social Science, York University

37. Eric Miller, Contract Faculty, York University

38. Rob Moir, Associate Professor of Economics, Associate Dean (Research & Special Projects), Acting Dean, Faculty of Business, University of New Brunswick, Saint John

39. Linda Peake, Professor, Director of The City Institute, York University

40. Ellie Perkins, Professor, Faculty of Environmental Studies, York University

41. David Pringle, Progressive Economics Forum

42. Lars Osberg, Professor, Department of Economics, Dalhousie University

43. Mario Seccareccia, Professor Emeritus, Department of Economics, University of Ottawa

44. Brenda Spotton Visano, Professor, Economics and School of Public Policy and Administration, York University

45. Jim Stanford, Harold Innis Industry Professor of Economics, McMaster University

46. John Stapleton, Social Policy Expert, Open Policy Ontario

47. Almos Tassonyi, Executive Fellow, School of Public Policy, University of Calgary

48. Mel Watkins, Professor Emeritus, Department of Economics, University of Toronto

49. Barry Watson, Associate Professor of Economics, Faculty of Business, University of New Brunswick, Saint John

50. Vicki Zhang, Assistant Professor, Department of Statistical Sciences, University of Toronto

Cc: Hon. Lisa MacLeod, Ontario Minister of Community and Social Services
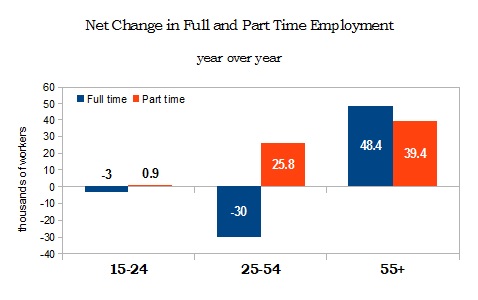
MEDIA RELEASE: Alberta should increase social spending; cuts are not the way to go

$
0
0

(June 24, 2019-Calgary) With Alberta’s economy still facing challenges and vulnerabilities, the Alberta government should not be doling out tax cuts or cutting social spending, according to the Alberta Alternative Budget (AAB) released today.

“Alberta still has, by far, the lowest debt-to-GDP ratio of any province,” says Nick Falvo, editor of the report. “We are in a good position to increase spending on education, invest in affordable child care, offer free dental care to Albertans under 18 years, and support other programs that would help Albertans facing unpredictability in the job market.”

The AAB is an annual exercise whose working group consists of researchers, economists, and members of civil society. The AAB  aims to create a progressive vision for Alberta to boost economic growth and reduce income inequality.

Today’s report calls for the introduction of a harmonized sales tax to reduce Alberta’s reliance on profit from energy markets, that have always been volatile. Under the previous government, important steps were taken to stabilize the economy through diversification and social spending.

“The UCP government has already cut close to $6 billion in provincial revenue by cancelling the carbon tax and cutting corporate taxes, and this is the wrong direction,” says Falvo. “Instead, investing in programs and infrastructure is what is needed to foster a vibrant Alberta.”

Download the report.

-30-

Contact: Nick Falvo, falvo.nicholas@gmail.com, 587-892-7855

Ten things to know about this year’s Alberta Alternative Budget

$
0
0

The Alberta Alternative Budget (AAB) is an annual exercise whose working group consists of researchers, economists, and members of civil society (full disclosure: I’m the Editor). Our general mandate is to create a progressive vision for Alberta to boost economic growth and reduce income inequality. This year’s document was released today, and here are 10 things to know:

  1. The NDP government of Rachel Notley government made important advances with respect to childcare, but much remains to be done. Specifically, the Notley government introduced a $25/day childcare pilot project and increased the provincial childcare budget by 27% since taking office. However, gender equality and women’s labour market participation in Alberta could be improved even further with universal childcare. This year’s AAB proposes that important steps be taken to get that done by investing an additional $1.65 billion in childcare over the next year.
  2. More than 80% of Alberta’s Kindergarten through Grade 3 classes currently exceed the provincial government’s own class size targets. What’s more, almost half of the province’s Grade 4 through Grade 12 classes exceed the government’s class size targets. And in high schools across the province, roughly half of all core subject classes exceed the Alberta Commission on Learning (ACOL) targets set in 2003. The AAB therefore recommends substantial increases in spending on k-12 education while also recommending that Alberta’s provincial government reduce funding for private schools (which are currently subsidized at higher rates than those in any other province).
  3. When it comes to gender and public policy, Alberta has a long way to go. Women in Alberta face the largest employment gender gap of any province. They are over-represented in lower-paying careers and their hourly pay for full-time work is only 80 cents on a man’s dollar. Further, Alberta lacks pay equity legislation. The AAB recommends that the annual budget of Alberta’s Ministry for Status of Women be increased by 30%, and that the provincial government create a pay equity task force to both investigate the reasons and propose solutions for the large gender pay gaps across industries and occupations in the province.
  4. There are nearly 6,000 reported cases of wage theft (i.e., unpaid wages) in Alberta each year. Further, in 2017/18, only 41% of wage-theft complaints were resolved within 180 days. And it’s generally accepted that formal wage-theft claims represent a small fraction of all instances of wage theft. The AAB therefore proposes that 75 additional employment standards officers be hired in the province, in order to prevent and remedy wage theft.
  5. One in 5 Alberta workers will be injured on the job this year; one in 11 seriously. This year’s AAB will therefore invest an additional $70 million in enforcement of Alberta’s occupational health and safety laws in order to make workplaces safer.
  6. Tuition fees as a share of university operating revenue have roughly tripled in Alberta over the last 30 years. The Notley government did freeze tuition fees in 2015, and recently introduced legislation that would tie tuition fee increases to inflation; but those measures alone don’t cut it. The AAB proposes a five-year ‘phase out’ of tuition fees, starting with a 20% reduction in tuition fees for all post-secondary students, including international students.
  7. Alberta still has, by far, the lowest debt-to-GDP ratio of any province. Alberta’s net debt-to-GDP ratio for 2018-19 is projected to be 6.5%. The next lowest is British Columbia’s, which stands at 15.2%. Though Alberta’s net debt-to-GDP ratio has risen quite quickly since the slump in oil prices, it’s hard to make the claim that the province is living beyond its means.
  8. Albertans collectively are taxed less than residents of any other province. According to Alberta Treasury Board and Finance, if Alberta’s provincial government adopted a tax structures similar to the next lowest-taxed province in the country (British Columbia), Alberta would generate an additional $8.7 billion in annual revenue.
  9. Alberta remains the only Canadian province without a provincial sales tax. The AAB Working Group estimates that the implementation of a 5% provincial sales tax in Alberta would generate approximately $5 billion in new revenue annually. What’s more, even after the implementation of this tax, Alberta would remain Canada’s lowest-taxed province!
  10. This year’s AAB further proposes that a new provincial sales tax be harmonized with the federal Goods and Services tax. The federal government already collects a 5% sales tax in the form of the Goods and Services Tax (GST). Following the lead of several other provinces, we propose that Alberta introduce a Harmonized Sales Tax (HST), which would allow the province to generate its own share of the revenue collected by the federal GST. Introducing a 5% provincial portion of a HST would still leave Alberta with a combined HST of 10%.

In Sum. In addition to providing a costed-out public policy alternative to the status quo in Alberta, each AAB chapter also provides a primer on the public policy topic in question. I think the document makes for excellent reading for researchers, educators, students and non-profit leaders. The media release, along with a link to the full document, can be found here.


Alberta must find alternatives to cutting social spending

$
0
0

I have an opinion piece in today’s Edmonton Journal about Alberta’s current fiscal situation.

Points raised in the blog post include the following:

-The Jason Kenney government will almost certainly announce cuts to social spending in the near future.

-Yet, more than 80% of Alberta’s kindergarten through Grade 3 classes currently exceed the provincial government’s own class-size targets.

-Tuition fees as a share of university operating revenue have roughly tripled in Alberta over the last 30 years.

-Social assistance (i.e., welfare) caseloads have risen substantially in Alberta since the start of the economic downturn.

-Alberta still has, by far, the lowest debt-to-GDP ratio of any Canadian province.

-Albertans are also taxed less than any residents of any other province.

-Meanwhile, Alberta remains the only Canadian province without a provincial sales tax.

The link to the opinion piece is here.

Ten things to know about poverty measurement in Canada

$
0
0

I’ve written a blog post providing an overview of poverty measurement in Canada. Points raised in the post include the following:

-One’s choice of poverty measure has a major impact on whether poverty is seen to be increasing or decreasing over time.

-Canada’s federal government recently chose the make the Market Basket Measure (MBM) its official poverty measure.

-According to the MBM, Canada has seen a major decrease in poverty over the past decade.

-Also according to the MBM, there is very little seniors’ poverty in Canada.

-The debate about poverty measurement in Canada has largely ignored the concept of asset poverty.

The link to the blog post is here.

Assessing progress on St. John’s Plan to End Homelessness

$
0
0

I’ve written an assessment of the 2014-2019 St. John’s Community Plan to End Homelessness. The full assessment can be found here.

Points raised in the assessment include the following:

-Newfoundland and Labrador has the highest unemployment rate of any Canadian province. This pulls people into homelessness, while also making it more challenging for the provincial government to finance policy asks (such as subsidized housing with social work support).

-People interviewed as part of the assessment process expressed concern over the fact that nearly 40% of emergency shelter beds in St. John’s are run by for-profit providers (but paid for by the provincial government).

-The Trudeau government increased annual federal funding for homelessness (beginning with the 2016 federal budget) and this has been helpful at the local level in St. John’s (just as these increased federal funding levels helped other communities across Canada address homelessness).

-One promising development in Newfoundland and Labrador has been new child welfare legislation allowing youth to continue receiving care until the age of 21 (it used to be 18).

Affordable housing, homelessness and the upcoming federal budget

$
0
0

I’ve written a ‘top 10’ overview of things to know about affordable housing and homelessness, as they relate to Canada’s upcoming federal budget. The overview is based on the affordable housing and homelessness chapter in the just-released Alternative Federal Budget.

A link to the ‘top 10’ overview is here.

Social assistance: Do higher benefit levels lead to higher caseloads?

$
0
0

As part of my PhD thesis, I did some statistical analysis in which I asked the question: “Do higher social assistance benefit levels lead to higher caseloads?”

I have recently updated the data and had it published in a journal.

Here’s a short summary of the journal article’s main findings.

Lifting singles out of poverty in canada

$
0
0

I’ve written a report for the Institute for Research on Public Policy about social assistance—specifically, about social assistance for employable single adults without dependants.

A ‘top 10’ overview of the report can be found here.

the recession’s likely long-term impact on homelessness

$
0
0

I’ve just written a report for Employment and Social Development Canada on the current recession’s likely long-term impact on homelessness in Canada. An overview of the report can be found here.


Latest Images